Fig. 3.
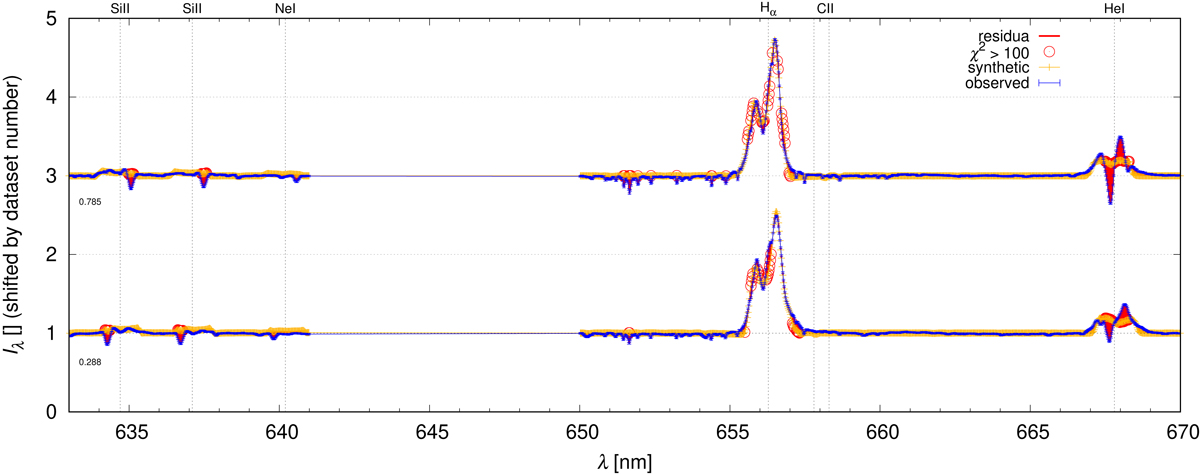
Normalised spectra of β Lyr A for two out-of-eclipse phases (0.288 and 0.785). Observed data with uncertainties are indicated (blue), as well as synthetic data (yellow), residua (red), and large χ2 contributions (red circles). This 1st model was only fitted to these two spectra. The Hα emission profile and its EW are well described, but there are systematic differences for the He I 6678 line; the synthetic Si II 6347, 6371 and Ne I 6402 lines have low EW.
Current usage metrics show cumulative count of Article Views (full-text article views including HTML views, PDF and ePub downloads, according to the available data) and Abstracts Views on Vision4Press platform.
Data correspond to usage on the plateform after 2015. The current usage metrics is available 48-96 hours after online publication and is updated daily on week days.
Initial download of the metrics may take a while.