Fig. 19.
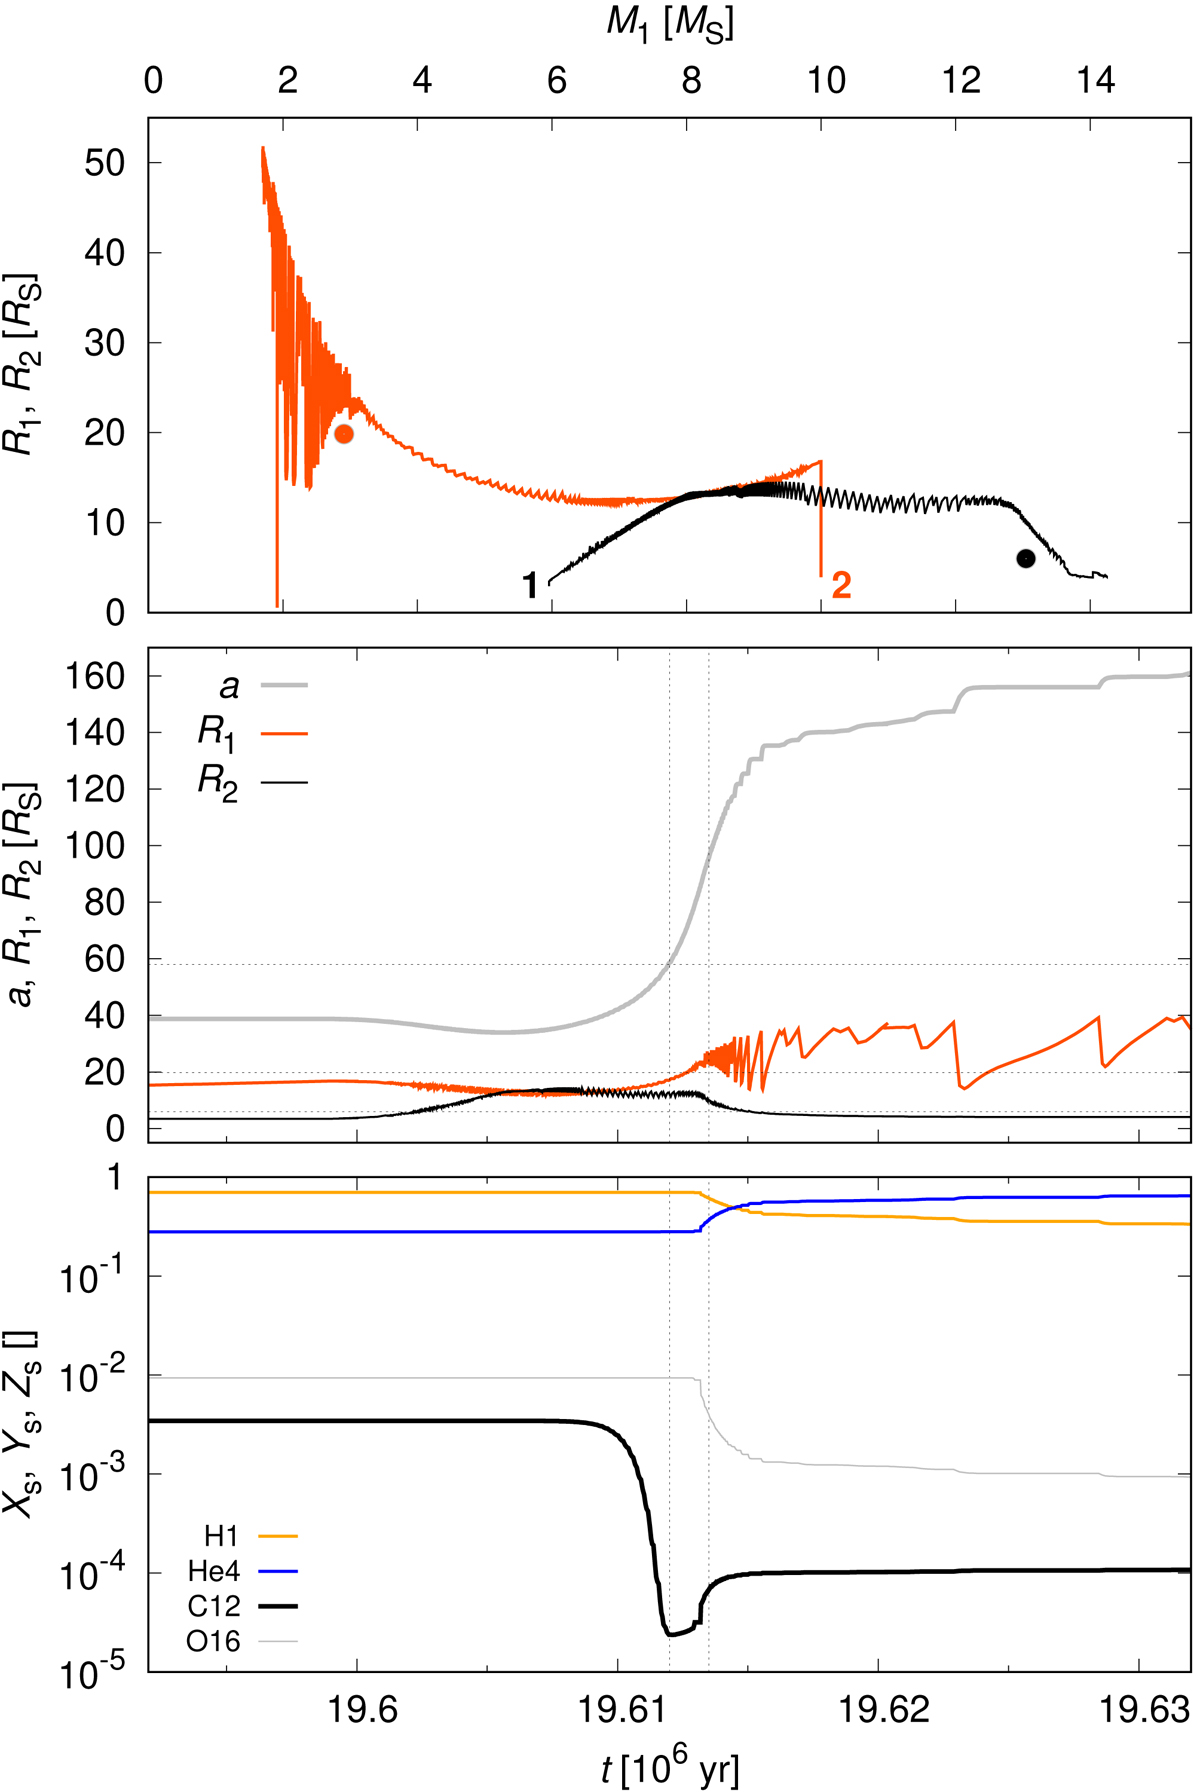
Stellar evolution of a binary corresponding to β Lyr A. The component radii R1, R2 vs. the primary mass M1 are plotted (top), with observed values indicated by full circles, together with the distance a and R1, R2 vs. time t (middle); see horizontal dashed lines, and surface abundances X, Y, AC12, AO16 vs. time t (bottom). At t = 19.613 × 10⁶ yr, the mass ratio q corresponds to the observed one.
Current usage metrics show cumulative count of Article Views (full-text article views including HTML views, PDF and ePub downloads, according to the available data) and Abstracts Views on Vision4Press platform.
Data correspond to usage on the plateform after 2015. The current usage metrics is available 48-96 hours after online publication and is updated daily on week days.
Initial download of the metrics may take a while.