Free Access
Fig. 14.
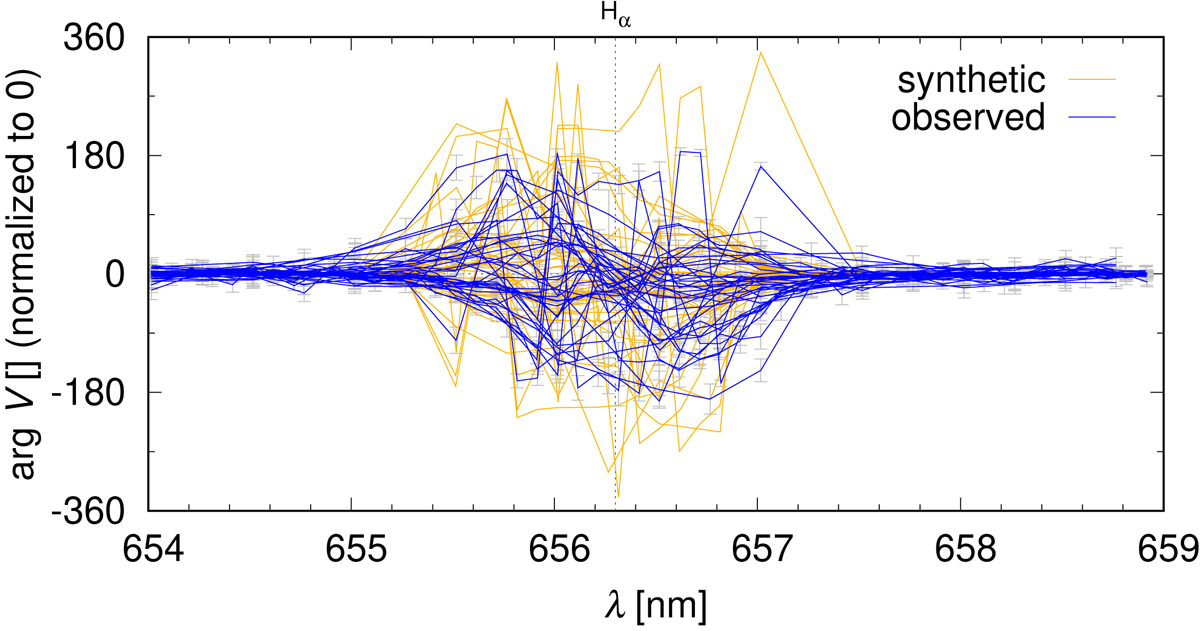
Similar to Fig. 13, for the differential phases argdV vs. λ. On average, phase changes are comparable in both observed and synthetic data. There are some remaining phase slips that are also fitted for.
Current usage metrics show cumulative count of Article Views (full-text article views including HTML views, PDF and ePub downloads, according to the available data) and Abstracts Views on Vision4Press platform.
Data correspond to usage on the plateform after 2015. The current usage metrics is available 48-96 hours after online publication and is updated daily on week days.
Initial download of the metrics may take a while.