Free Access
Fig. 1.
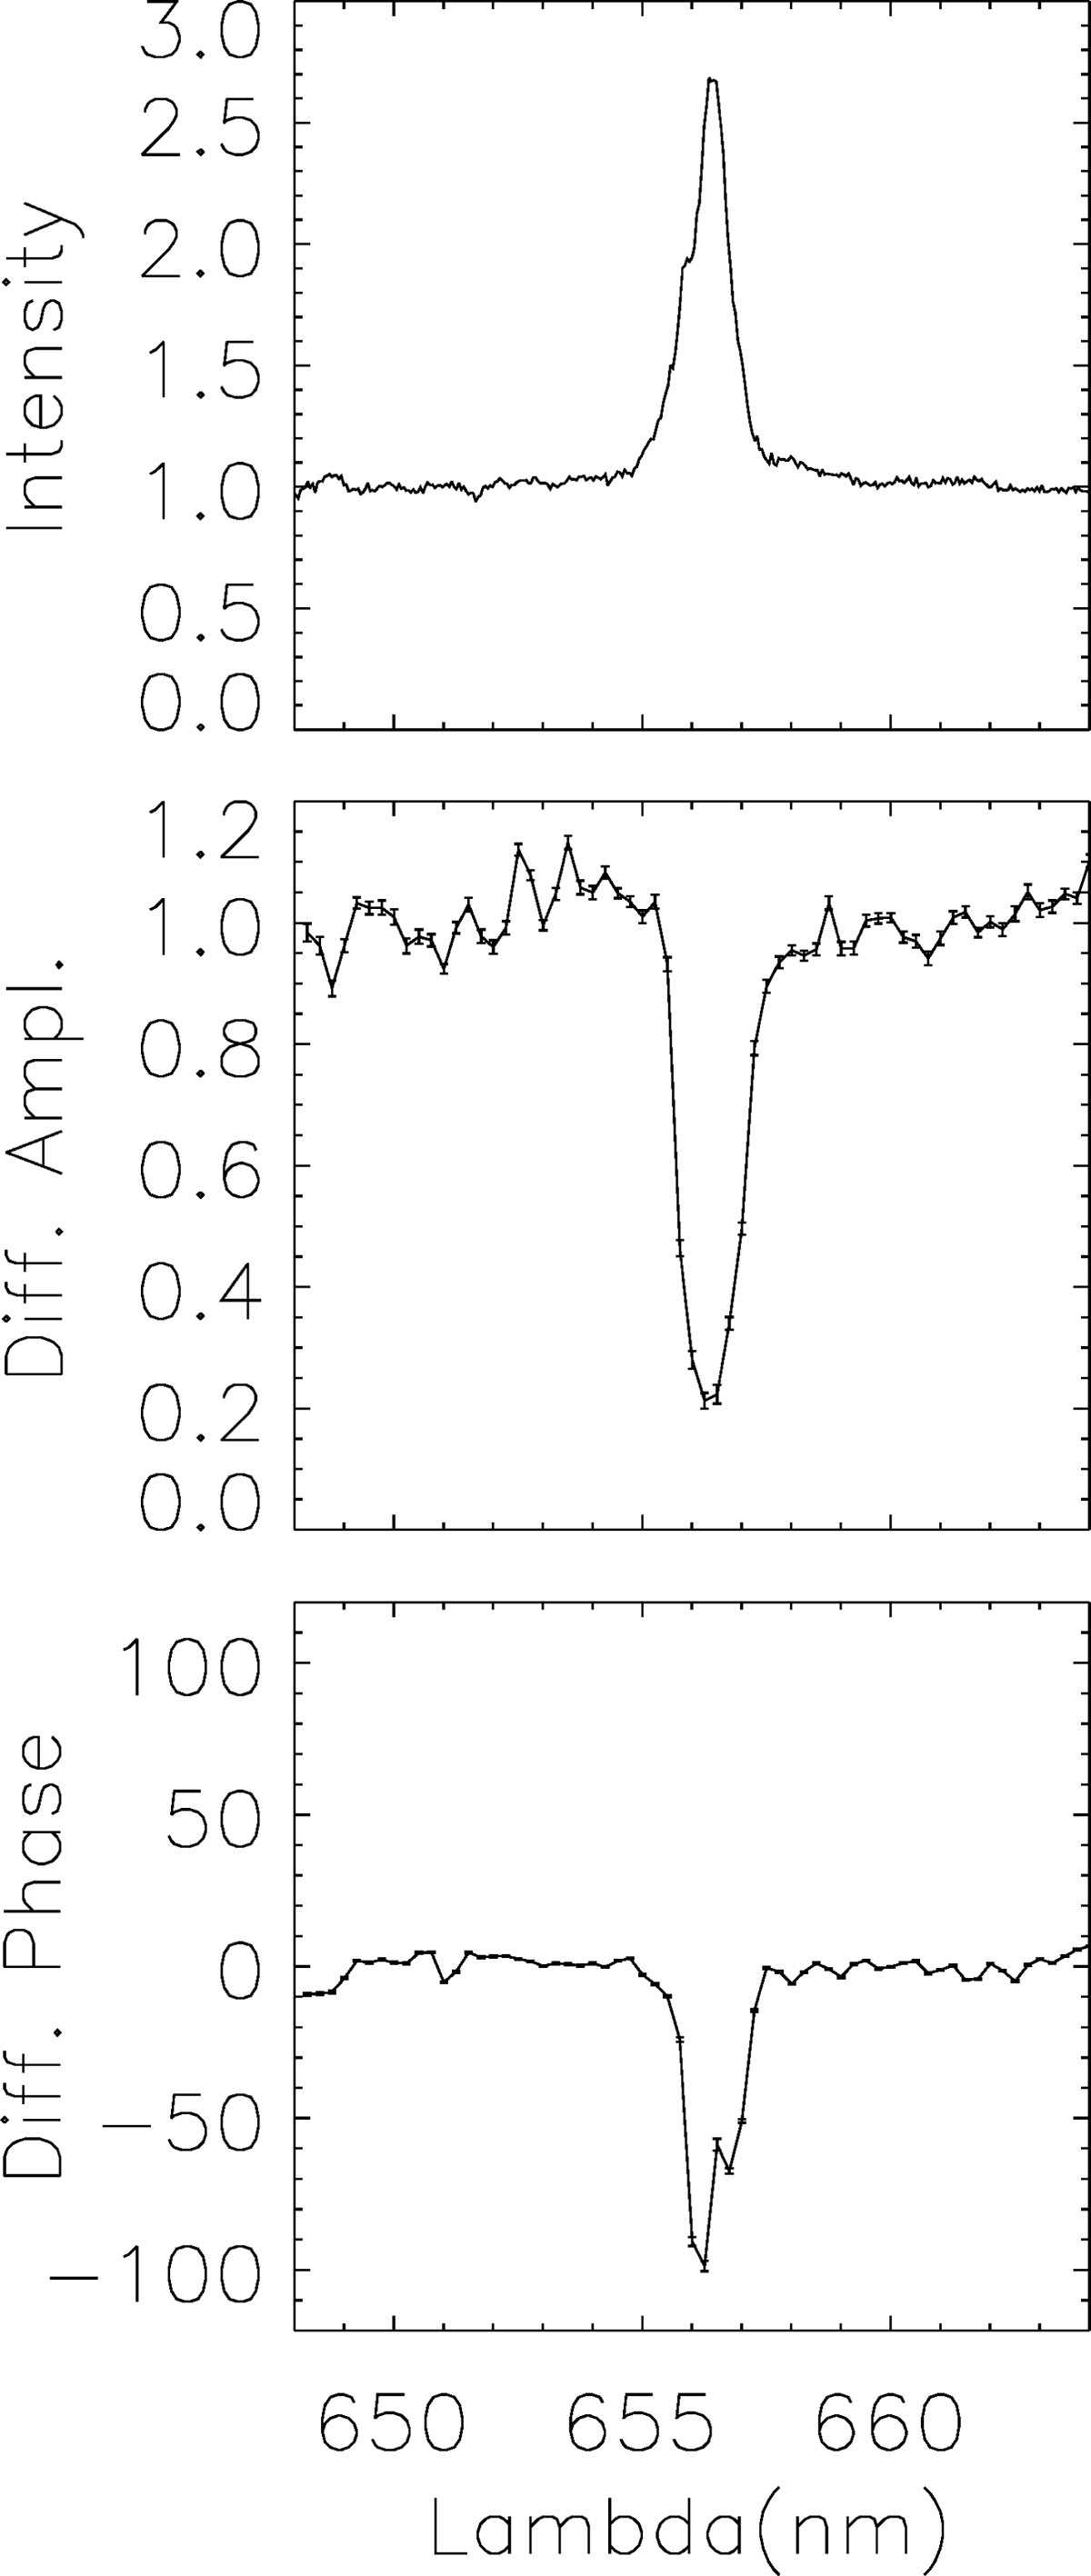
Example of VEGA differential visibility measurement during the night of 27 Jun 2013 with the 140 m E2W2 baseline. Top: Hα line (continuum normalised to 1). Middle: amplitude of the differential visibility (normalised to 1 in the continuum). Bottom: phase of the differential visibility in degrees.
Current usage metrics show cumulative count of Article Views (full-text article views including HTML views, PDF and ePub downloads, according to the available data) and Abstracts Views on Vision4Press platform.
Data correspond to usage on the plateform after 2015. The current usage metrics is available 48-96 hours after online publication and is updated daily on week days.
Initial download of the metrics may take a while.