Fig. 4.
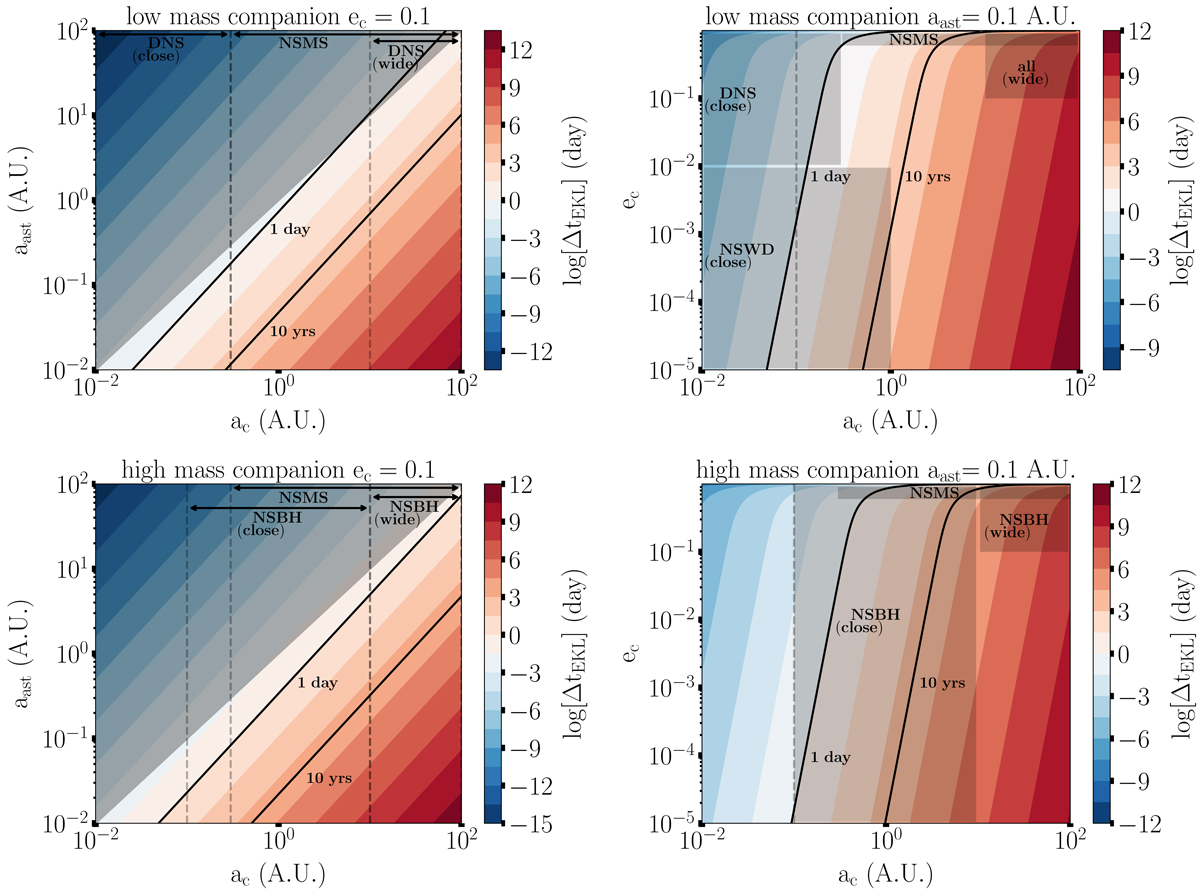
Same as Fig. 3, but for the relative Kozai-Lidov time delay (given by Eq. (16)). The solid lines represent the limits where the relative delay equals 1 day (for sources producing day-repeaters) and the dashed line is the limit where the relative delay equals 10 years (observational time beyond which sources cannot be observed as repeaters).
Current usage metrics show cumulative count of Article Views (full-text article views including HTML views, PDF and ePub downloads, according to the available data) and Abstracts Views on Vision4Press platform.
Data correspond to usage on the plateform after 2015. The current usage metrics is available 48-96 hours after online publication and is updated daily on week days.
Initial download of the metrics may take a while.