Free Access
Fig. C.3.
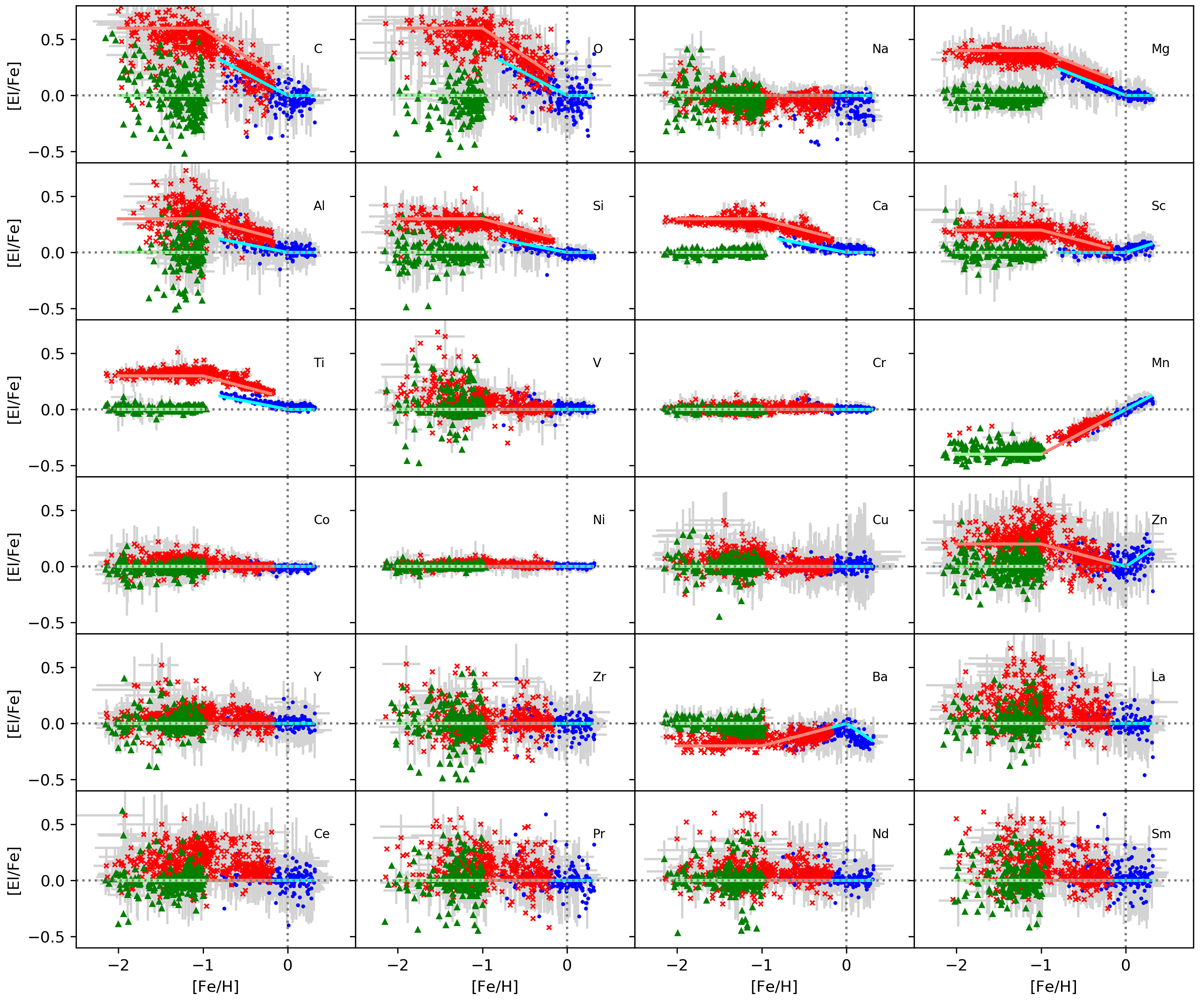
Chemical abundance distribution measured by SP_Ace for spectra with variable continuum opacity and SP_Ace metallicity Salaris correction. The expected distributions are shown by the colored solid lines. Symbols and colors are as in Fig. 4.
Current usage metrics show cumulative count of Article Views (full-text article views including HTML views, PDF and ePub downloads, according to the available data) and Abstracts Views on Vision4Press platform.
Data correspond to usage on the plateform after 2015. The current usage metrics is available 48-96 hours after online publication and is updated daily on week days.
Initial download of the metrics may take a while.