Fig. 1.
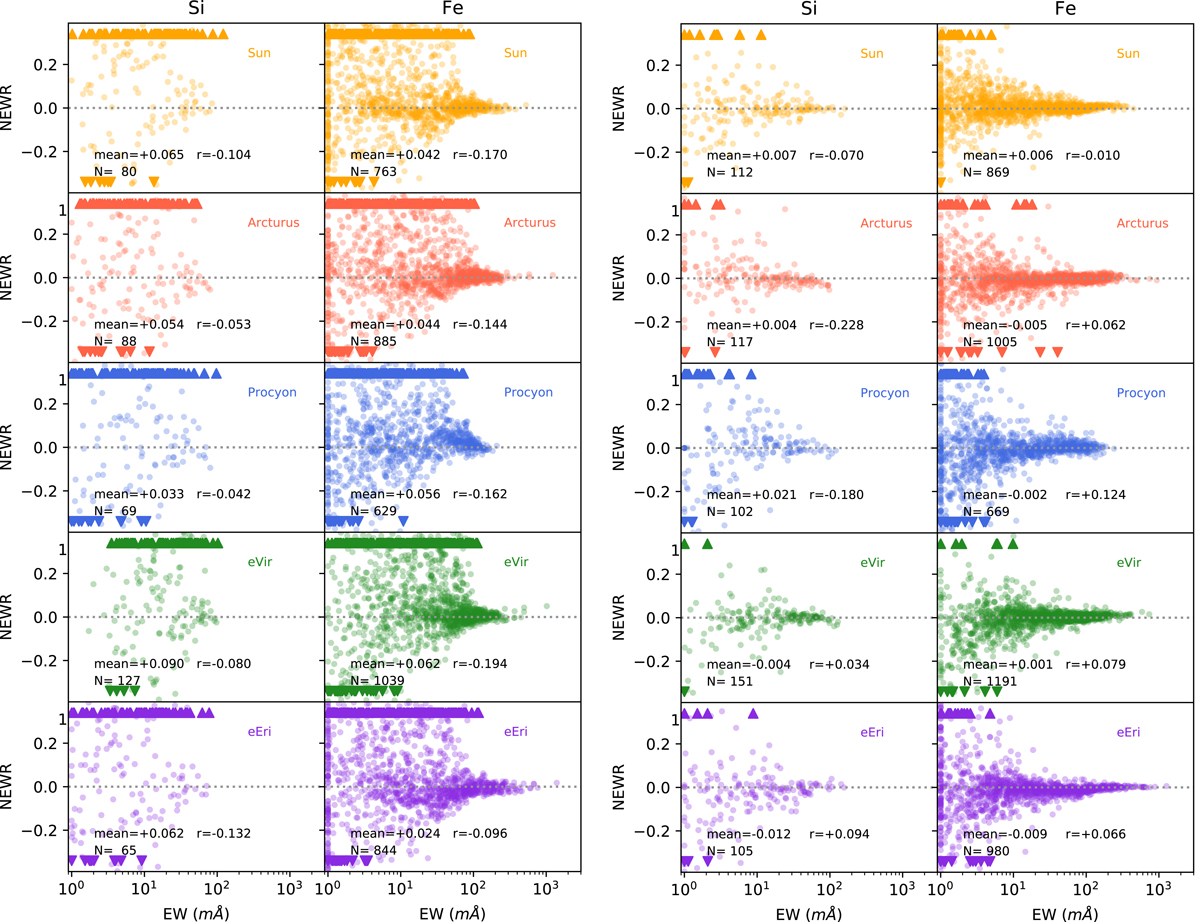
Distributions of the NEWRs of the elements Si and Fe as a function of their EW for the five standard stars before (left) and after (right) the calibration. The standard stars are indicated by different colors (from top to bottom): the Sun (yellow), Arcturus (red), Procyon (blue), ϵ Vi (green), and ϵ Eri (purple). The triangles represent lines for which NEWR is larger than +0.4 or smaller than −0.4. In each panel the mean and the Pearson correlation parameter r are shown.
Current usage metrics show cumulative count of Article Views (full-text article views including HTML views, PDF and ePub downloads, according to the available data) and Abstracts Views on Vision4Press platform.
Data correspond to usage on the plateform after 2015. The current usage metrics is available 48-96 hours after online publication and is updated daily on week days.
Initial download of the metrics may take a while.