Fig. 4.
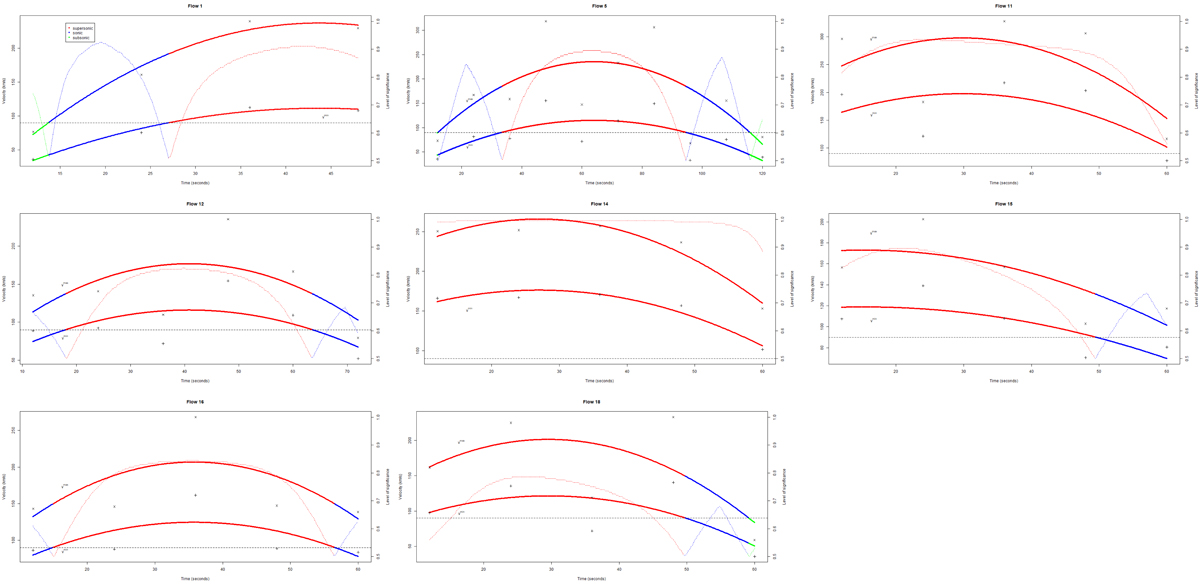
Velocity lower bound ![]() and upper bound
and upper bound ![]() together with the classification level of significance 100(1 − α)%. The red, blue, and green (solid line) curves indicate a supersonic, sonic, and subsonic classification (left ordinate axes), respectively at a 50% level of significance. The dotted line curves show the level of significance (rights ordinate axes). The horizontal dashed line represents the background sound speed. These flows all have a majority supersonic classification.
together with the classification level of significance 100(1 − α)%. The red, blue, and green (solid line) curves indicate a supersonic, sonic, and subsonic classification (left ordinate axes), respectively at a 50% level of significance. The dotted line curves show the level of significance (rights ordinate axes). The horizontal dashed line represents the background sound speed. These flows all have a majority supersonic classification.
Current usage metrics show cumulative count of Article Views (full-text article views including HTML views, PDF and ePub downloads, according to the available data) and Abstracts Views on Vision4Press platform.
Data correspond to usage on the plateform after 2015. The current usage metrics is available 48-96 hours after online publication and is updated daily on week days.
Initial download of the metrics may take a while.