Free Access
Fig. 3.
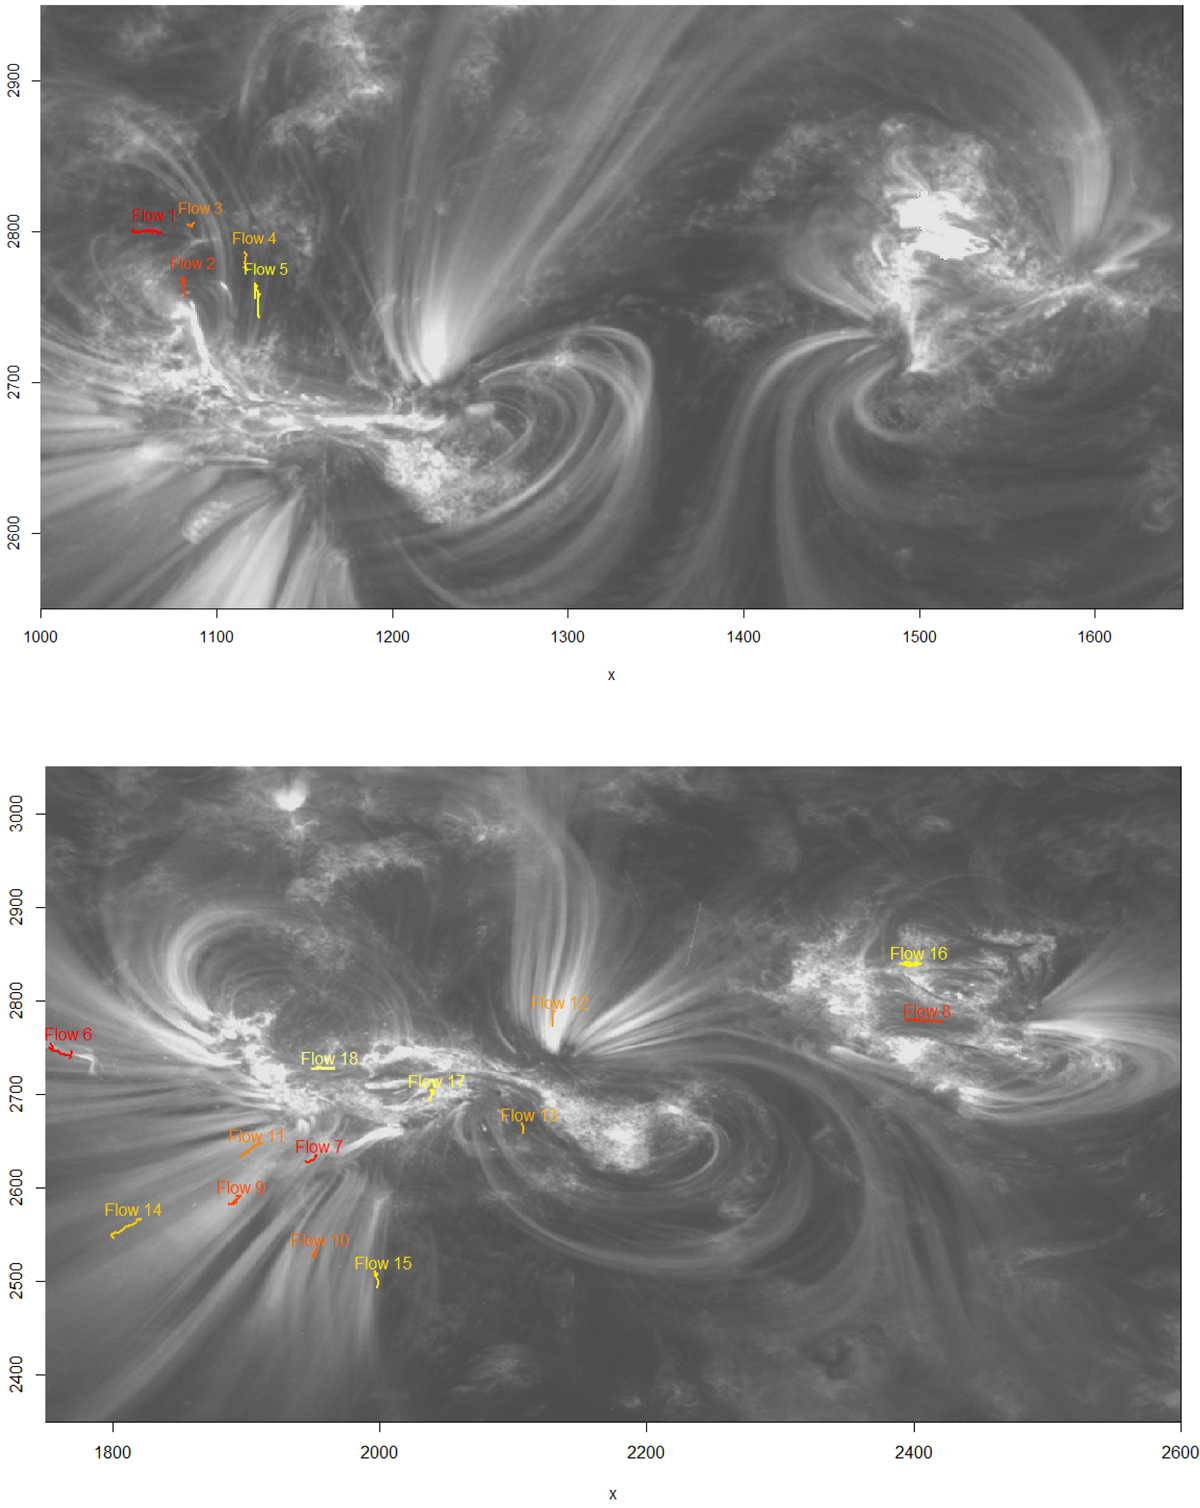
Illustration of the flows identified by applying the proposed methodology to the SDO image data from the 171 Å spectral line for the date 6 March 2012 from 12:22:00 to 12:35:00 referred to as the limb data (top) and again for the date 9 March 2012 from 03:00:00 to 03:24:00 referred to as the central data (bottom).
Current usage metrics show cumulative count of Article Views (full-text article views including HTML views, PDF and ePub downloads, according to the available data) and Abstracts Views on Vision4Press platform.
Data correspond to usage on the plateform after 2015. The current usage metrics is available 48-96 hours after online publication and is updated daily on week days.
Initial download of the metrics may take a while.