Fig. 8.
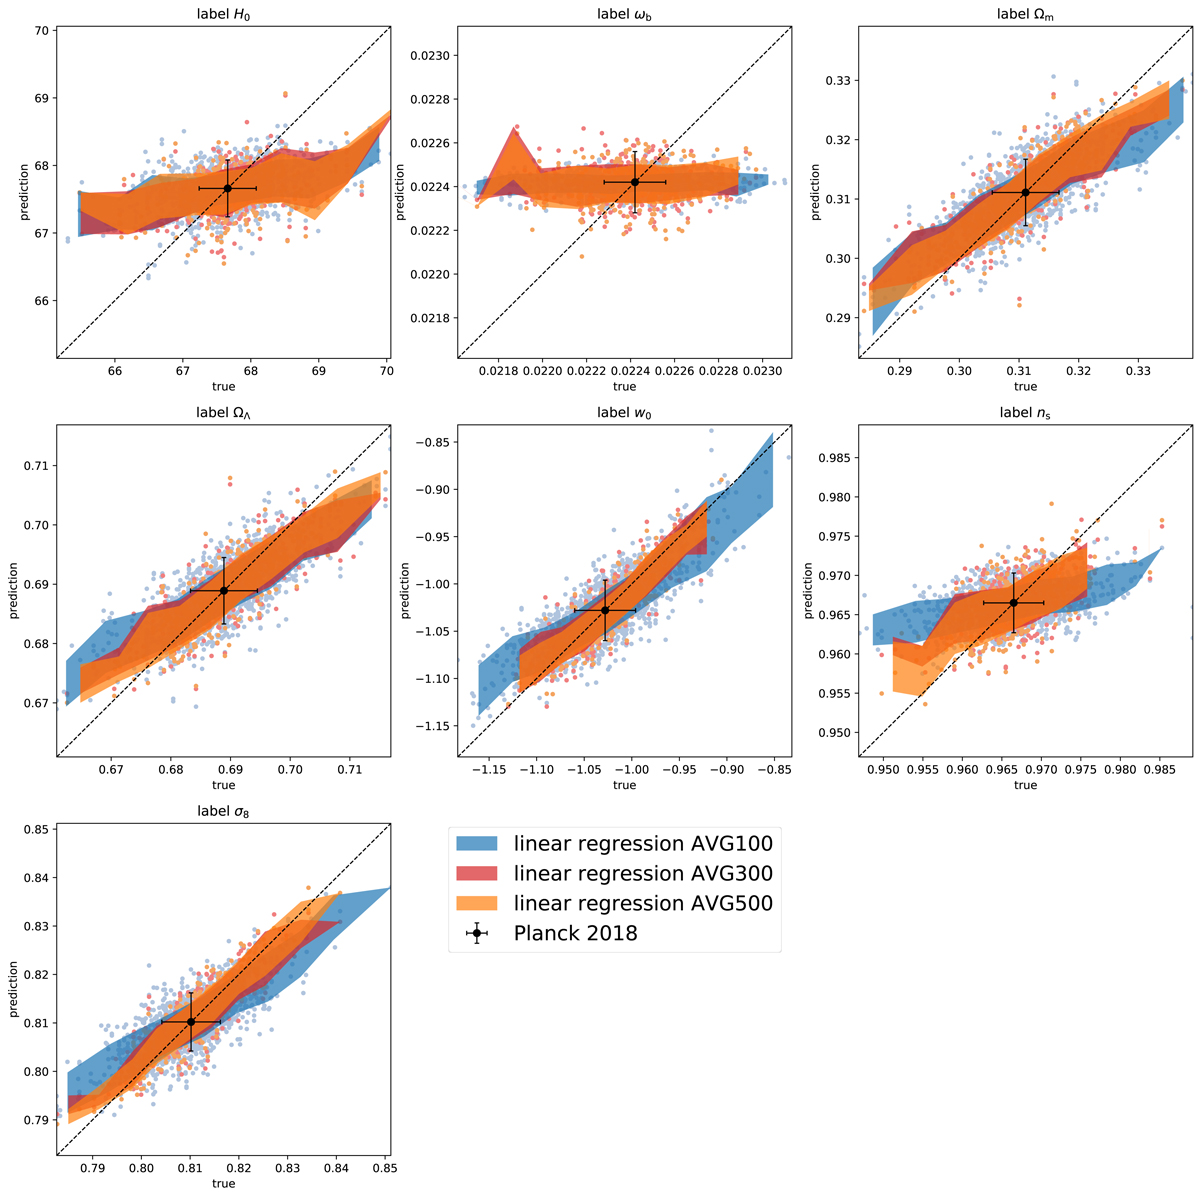
Performance on the test set of the linear regression model for each cosmological parameter, and for the three datasets, AVG100, AVG300, and AVG500, with θs = 2′. The dots represent individual predictions. The shaded regions delimit the 1 σ interval obtained dividing the test sample into 10 bins of the true label values and calculating the mean and standard deviation of the predictions. We obtain the best predictions with the AVG500 dataset and for the ΩM, ΩΛ, w0, and σ8 parameters.
Current usage metrics show cumulative count of Article Views (full-text article views including HTML views, PDF and ePub downloads, according to the available data) and Abstracts Views on Vision4Press platform.
Data correspond to usage on the plateform after 2015. The current usage metrics is available 48-96 hours after online publication and is updated daily on week days.
Initial download of the metrics may take a while.