Fig. 7.
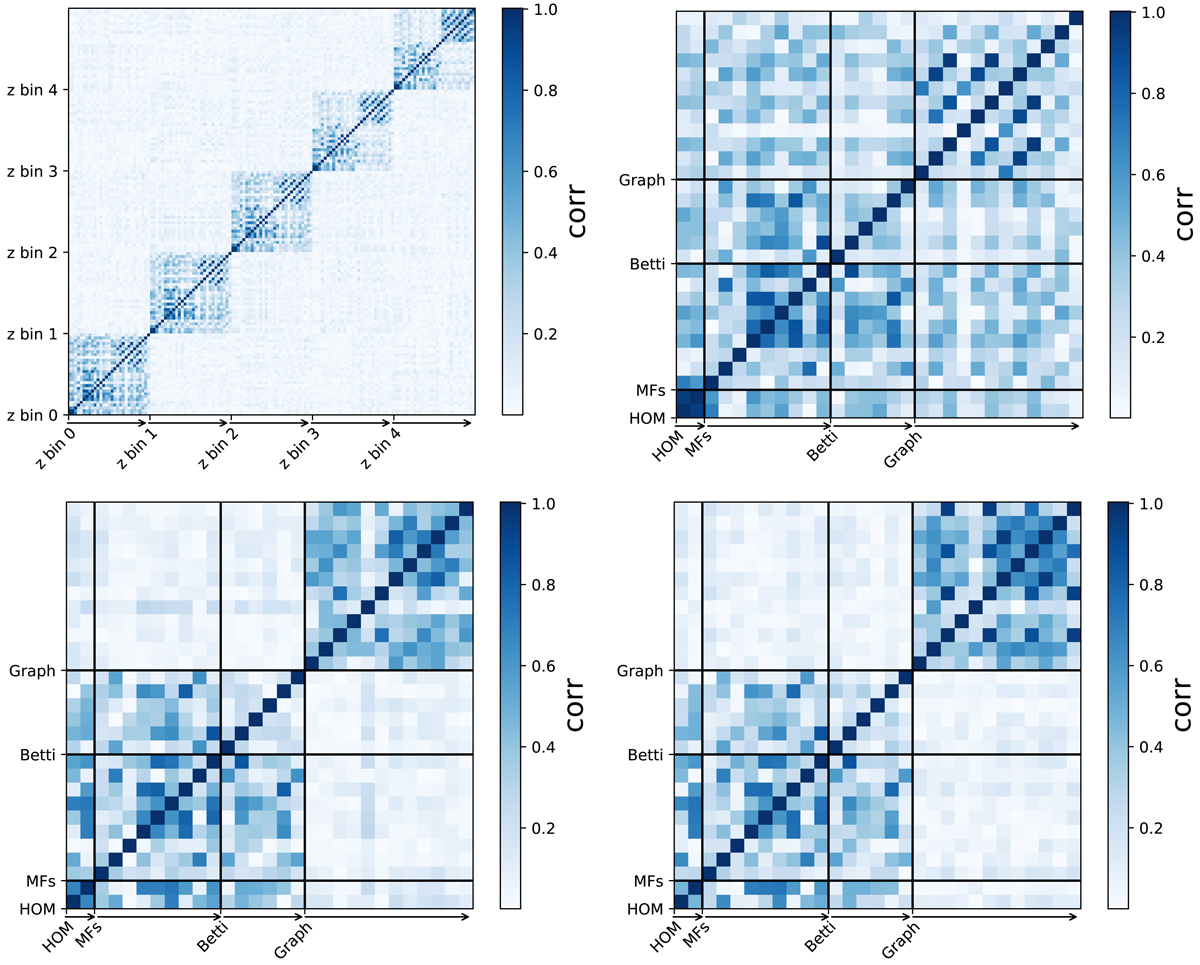
Top left: covariance matrix obtained using all 29 features for each redshift bin, measured on the 500 maps from the simulation with the constraints on PC18 parameters, with smoothing θs = 2′. Top right: same as in the top left panel, but for the first redshift bin only. Bottom left: same as in the top right panel, but measured on 300 maps for smoothing θs = 4′. Bottom right: same as in the top right panel, but measured on 300 maps for smoothing θs = 6′. We notice that within the same simulation, the correlation between features at different redshift bins is quite small due to the adopted binning, while for a given redshift bin some features appear to be more correlated than others. The correlation between the graph statistics and the rest of the estimators further decreases with increasing smoothing scale.
Current usage metrics show cumulative count of Article Views (full-text article views including HTML views, PDF and ePub downloads, according to the available data) and Abstracts Views on Vision4Press platform.
Data correspond to usage on the plateform after 2015. The current usage metrics is available 48-96 hours after online publication and is updated daily on week days.
Initial download of the metrics may take a while.