Fig. 4.
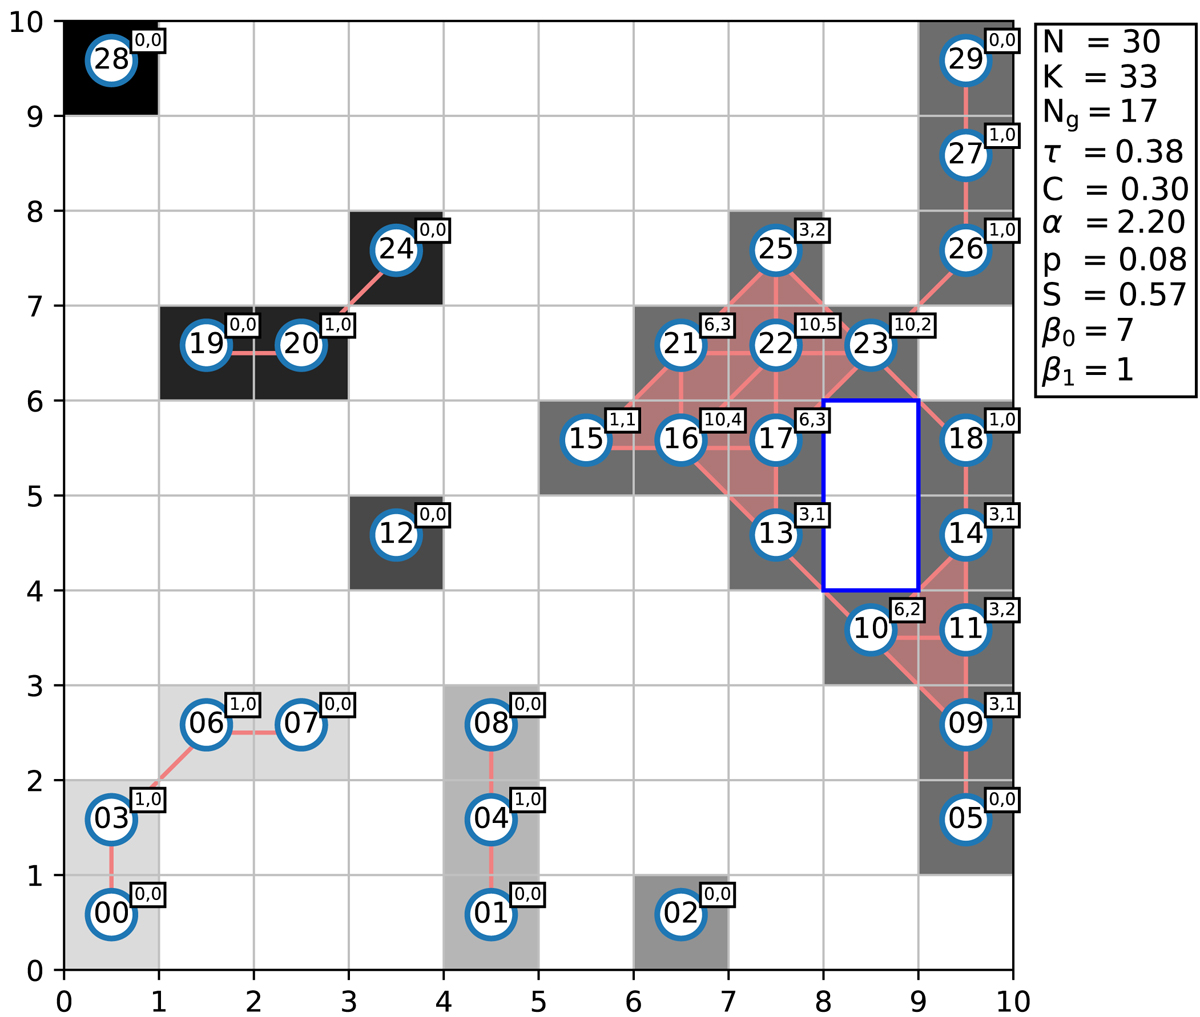
Working example obtained from an excursion set of a random Gaussian field on a 10 × 10 pixel map, to illustrate the quantities defined in Sect. 3.3 for the Betti numbers, and in Sect. 3.4 for the graph statistics. Every numbered blue circle is a vertex, the pink lines are edges, the shaded pink regions are triangles. Different connected regions are represented with different shades of gray, and the holes are outlined in dark blue. The tag on each vertex shows the quantities ki(ki − 1)/2, and Δi, which are the number of connected triples, and the number of triangles, centered on the vertex. The parameters listed on the right are, in order, N the numbers of vertices, K the number of edges, Ng the number of vertices belonging to the giant component, τ the transitivity, C the LCC, α the average degree, p the edge density, S the fraction of vertices belonging to the giant component, and β0, β1 the Betti numbers.
Current usage metrics show cumulative count of Article Views (full-text article views including HTML views, PDF and ePub downloads, according to the available data) and Abstracts Views on Vision4Press platform.
Data correspond to usage on the plateform after 2015. The current usage metrics is available 48-96 hours after online publication and is updated daily on week days.
Initial download of the metrics may take a while.