Fig. 2.
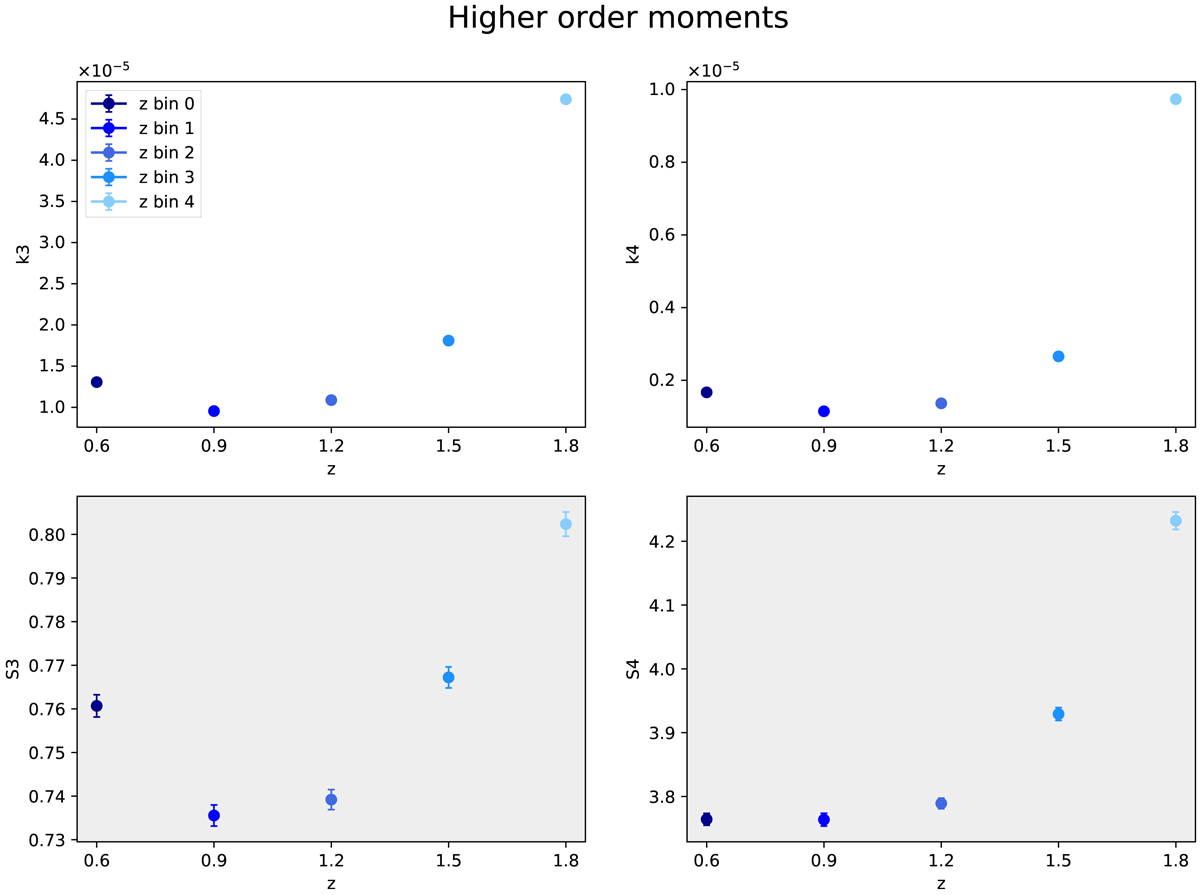
HOM calculated on the maps obtained from the simulation corresponding to the constraints on PC18 parameters, averaged over 500 maps, for all redshift bins, with smoothing scale θs = 2′. The error bars correspond to the standard deviation divided by the square root of the number of maps. The grayed-out plots in the bottom show that the S3 and S4 HOM were discarded from the rest of the analysis.
Current usage metrics show cumulative count of Article Views (full-text article views including HTML views, PDF and ePub downloads, according to the available data) and Abstracts Views on Vision4Press platform.
Data correspond to usage on the plateform after 2015. The current usage metrics is available 48-96 hours after online publication and is updated daily on week days.
Initial download of the metrics may take a while.