Fig. 7.
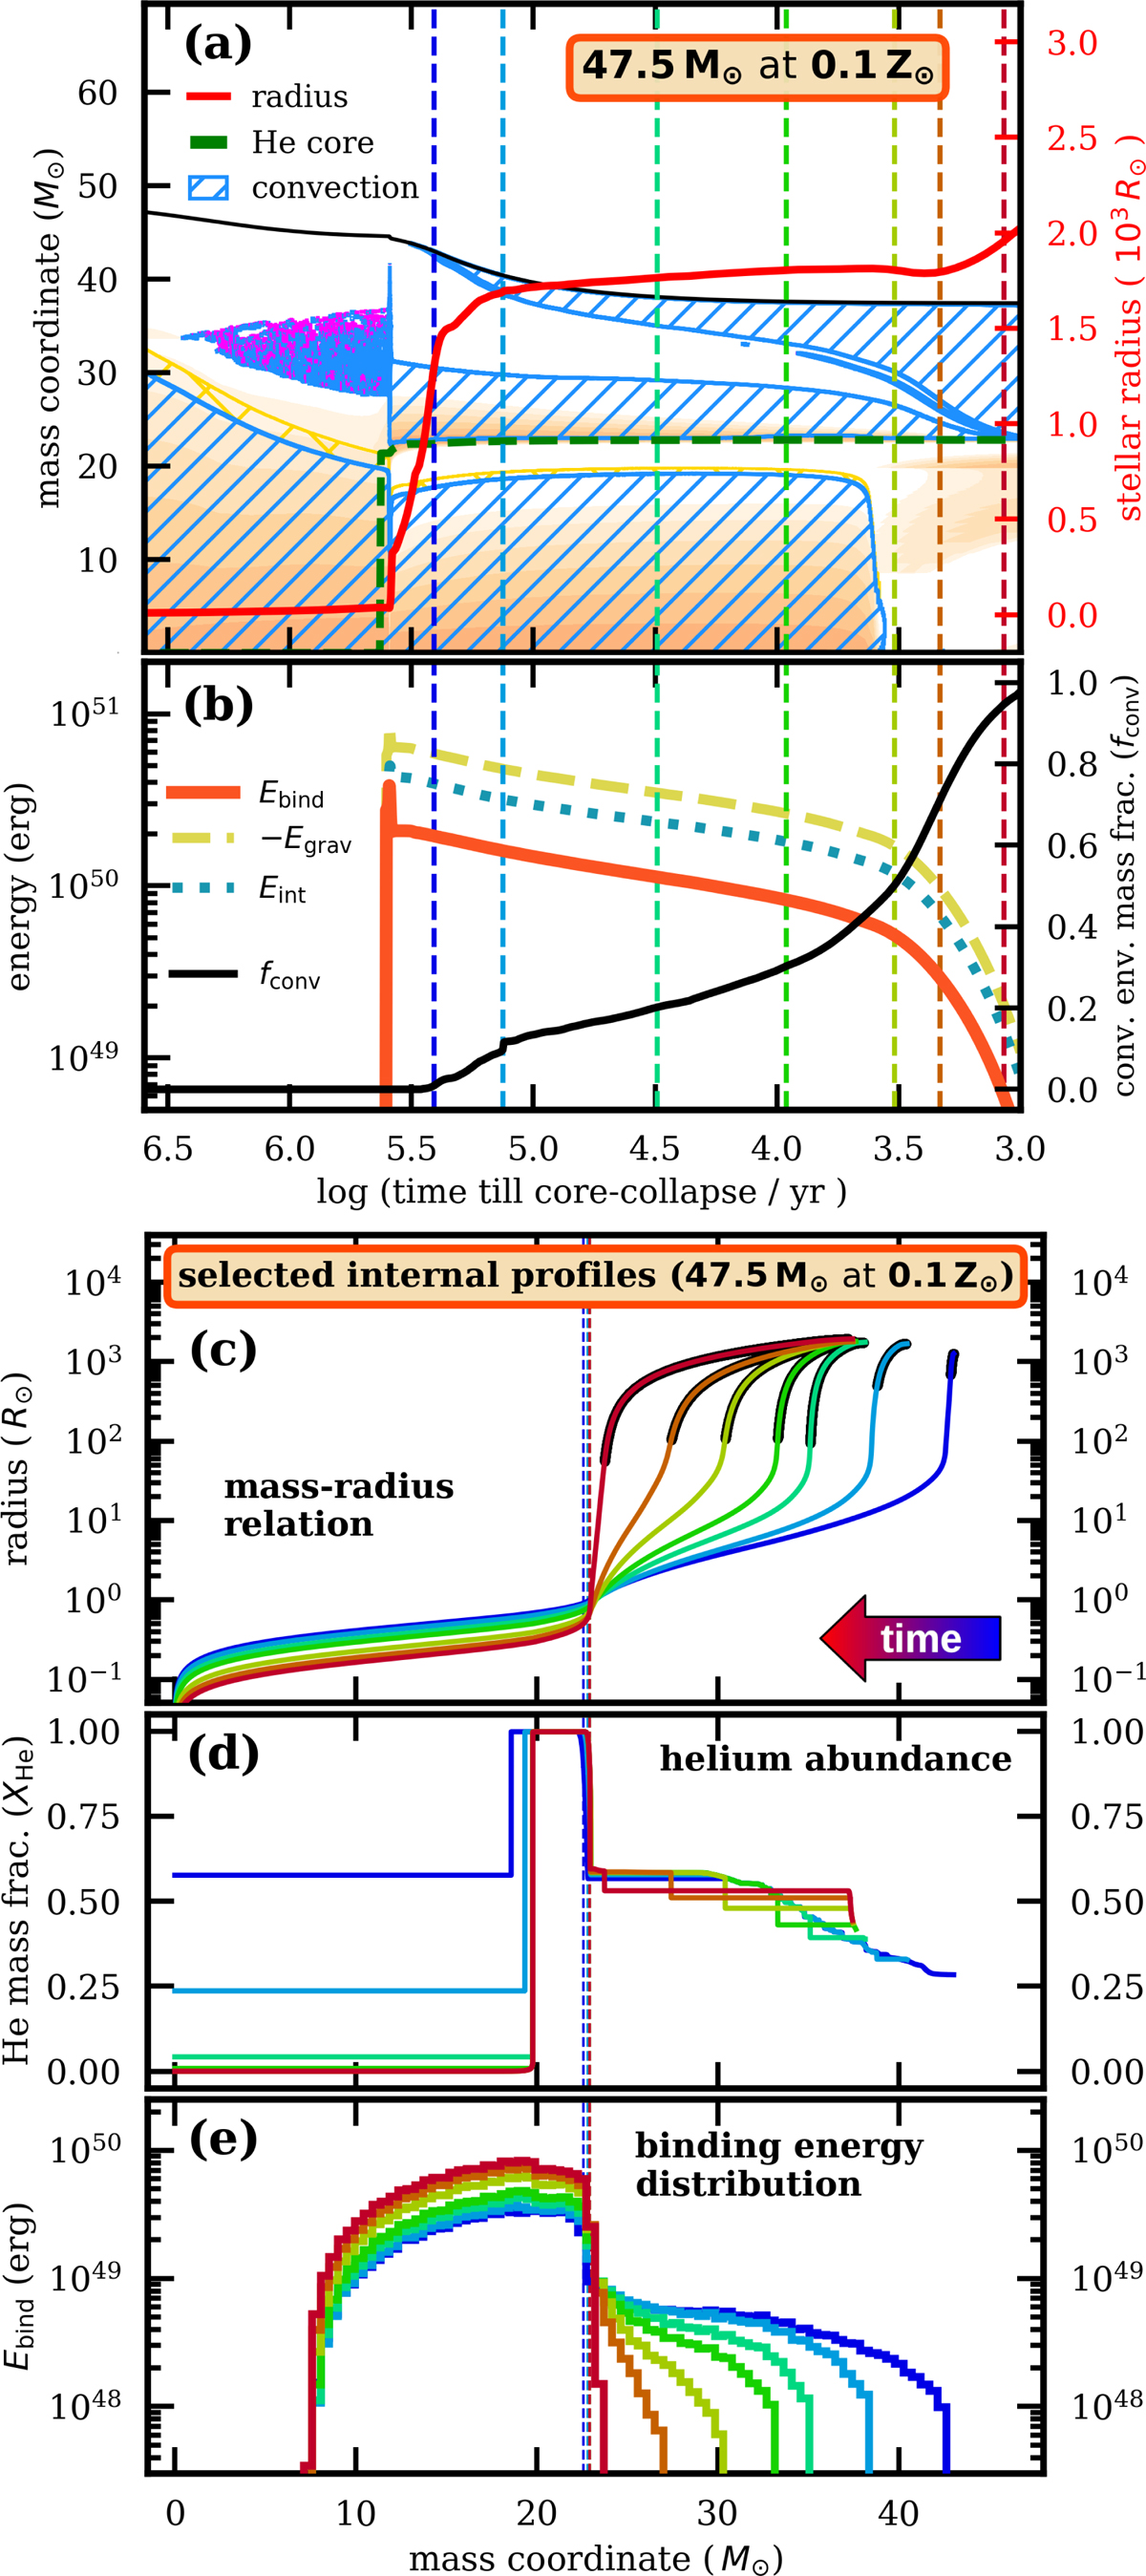
Detailed look at the evolution of a MZAMS = 47.5 M⊙ model at Z = 0.1 Z⊙ metallicity. Panel a shows the Kippenhahn diagram with stellar radius over-plotted in red. We note that the purple color shows regions of semiconvective mixing. Panel b shows the time evolution of the binding energy Ebind and its components: Egrav and Eint = Uth + Erec (see Eq. (3)) together with the convective envelope mass fraction fconv. Panels c–e show several internal profiles of the model, the position of which are marked in panels a and b with dashed vertical lines in corresponding colors. The outer convective zone is marked in bold in panel c. Solid vertical lines in panels c–e mark the core-envelope boundary for the CE evolution (i.e., the bifurcation point at XH = 0.1).
Current usage metrics show cumulative count of Article Views (full-text article views including HTML views, PDF and ePub downloads, according to the available data) and Abstracts Views on Vision4Press platform.
Data correspond to usage on the plateform after 2015. The current usage metrics is available 48-96 hours after online publication and is updated daily on week days.
Initial download of the metrics may take a while.