Fig. B.2.
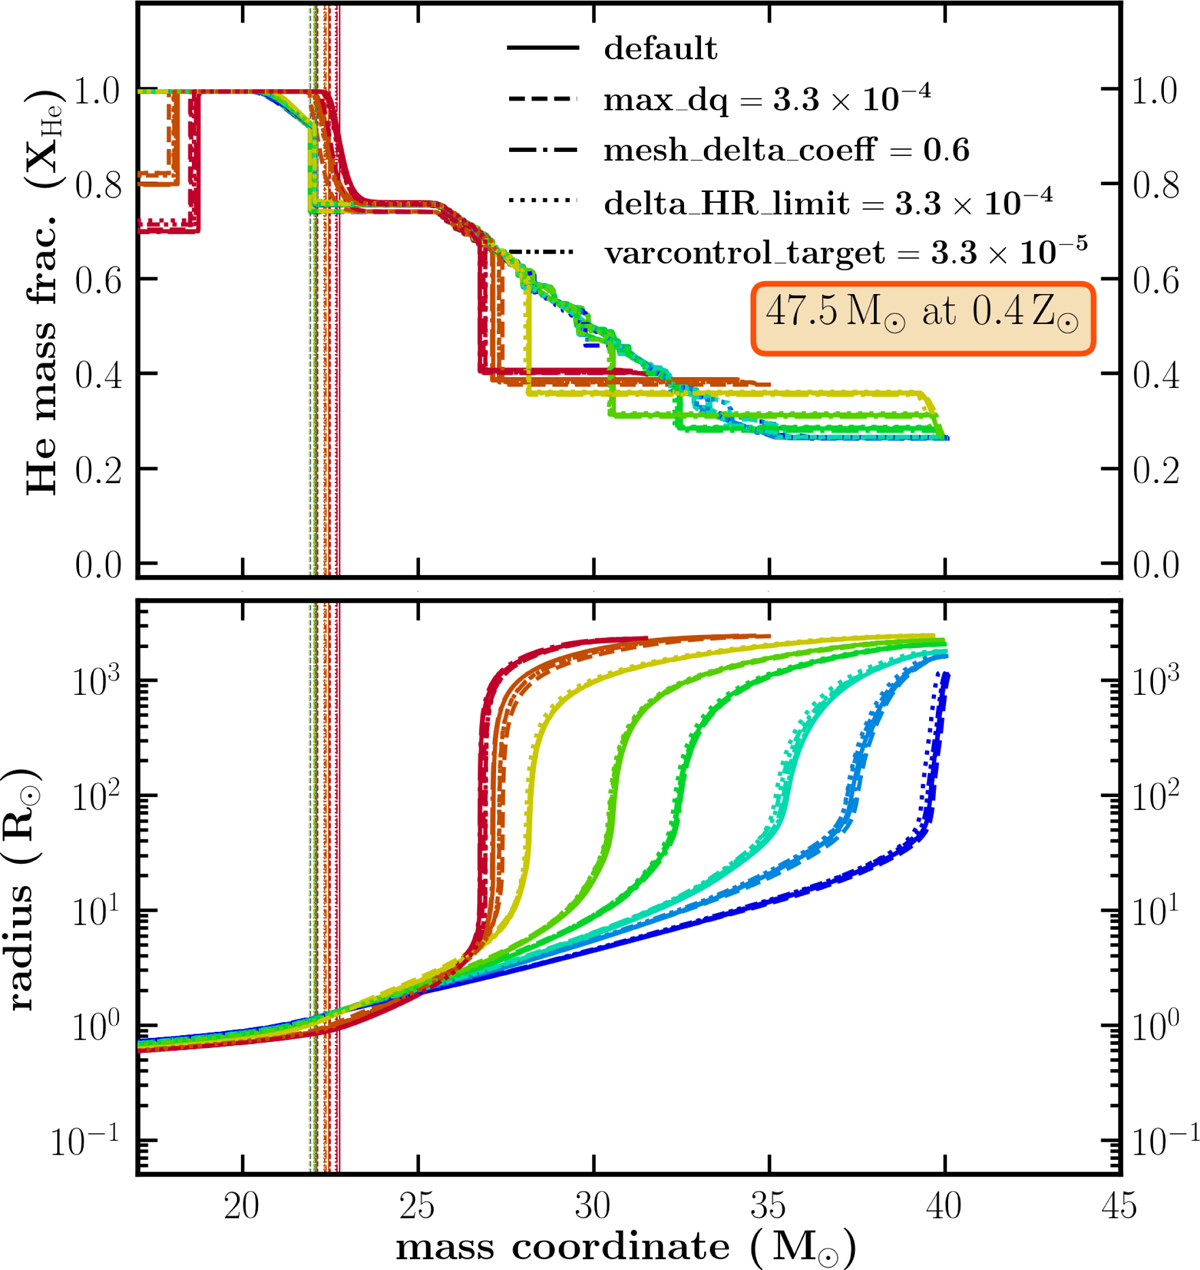
Comparison of the internal helium abundance and mass-radius profiles between the standard model (solid lines) and numerical variations with increased resolution (other lines), plotted for the case with MZAMS = 47.5 M⊙ and 0.4 Z⊙ analyzed in Sect. 3.4. As in Fig. 8, different colors correspond to different internal profiles of a model selected based on the depth of the outer convective zone (increasing as the color changes from blue to red). Vertical lines show the location of the bifurcation point for CE evolution.
Current usage metrics show cumulative count of Article Views (full-text article views including HTML views, PDF and ePub downloads, according to the available data) and Abstracts Views on Vision4Press platform.
Data correspond to usage on the plateform after 2015. The current usage metrics is available 48-96 hours after online publication and is updated daily on week days.
Initial download of the metrics may take a while.