Fig. B.1.
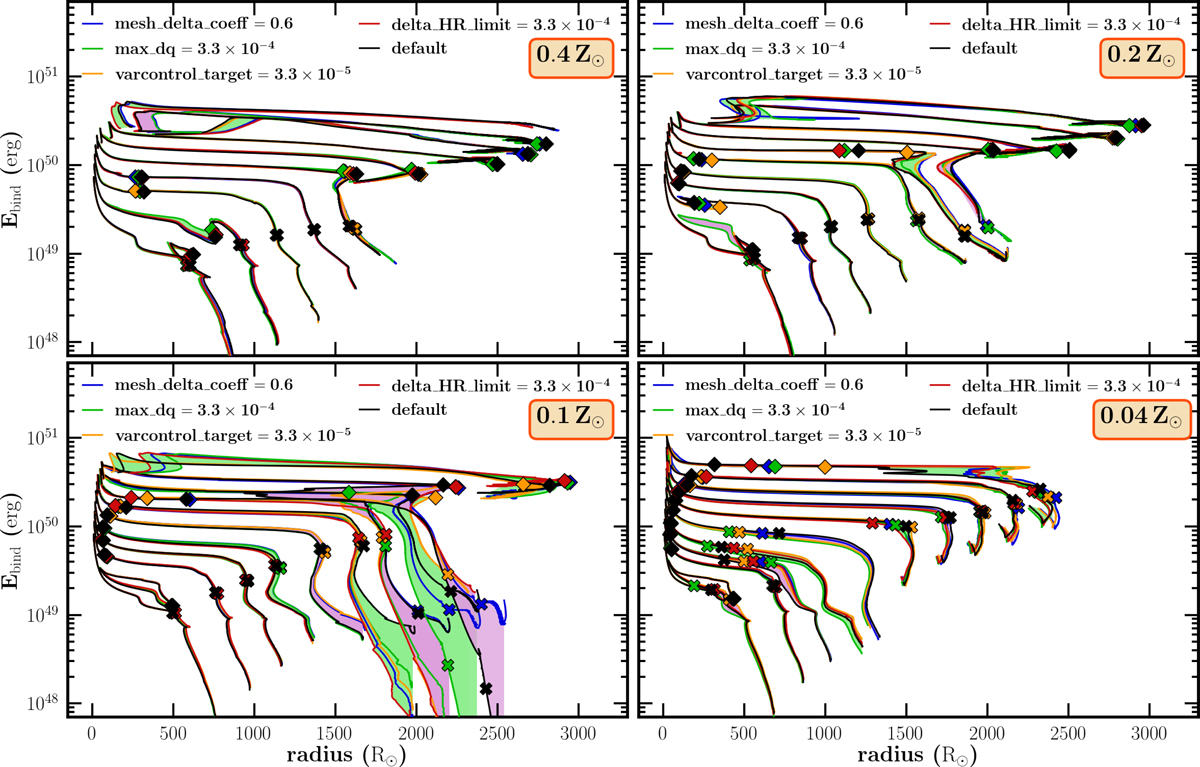
Comparison between the envelope binding energies Ebind of selected stellar models computed with the default assumptions (black line) and in four model variations with increased spacial or temporal resolution (see text for details), plotted as a function of the stellar radius. Selected stellar masses are 12, 16, 20, 25, 32.5, 40, 47.5, 55, 65, and 80 M⊙. Each panel shows a different metallicity. Diamonds mark the onset of core-helium burning, crosses indicate central helium depletion. Shaded regions mark the area of uncertainty span by model variations, with interchanging colors to increase readability. We note that only the post-MS evolution is included in the figure. Differences between the models are likely mainly due to envelope inflation and density inversions in the outer envelopes; see text for details. None of the numerical difficulties affect the conclusions of this study.
Current usage metrics show cumulative count of Article Views (full-text article views including HTML views, PDF and ePub downloads, according to the available data) and Abstracts Views on Vision4Press platform.
Data correspond to usage on the plateform after 2015. The current usage metrics is available 48-96 hours after online publication and is updated daily on week days.
Initial download of the metrics may take a while.