Fig. A.1.
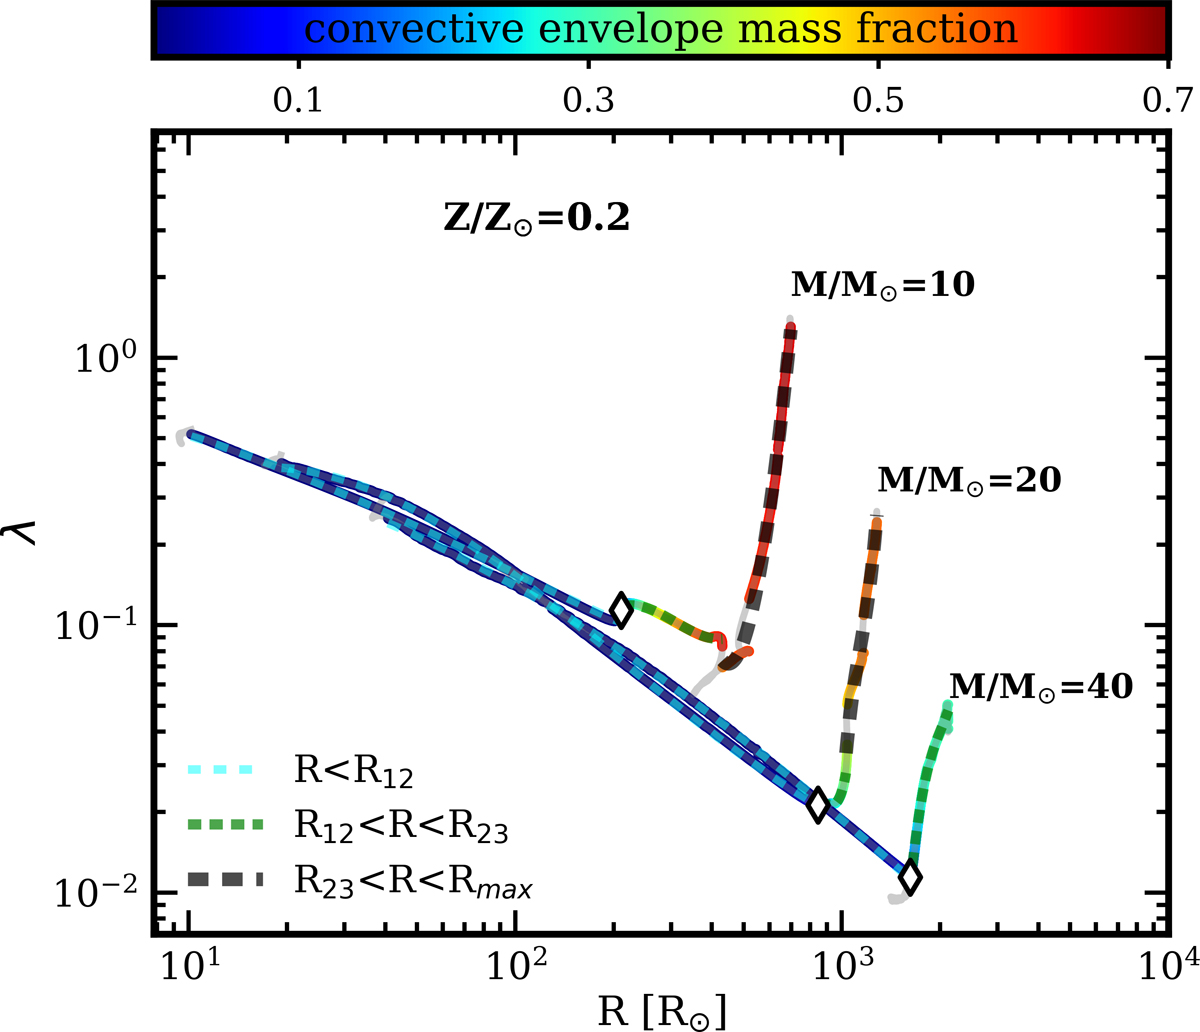
Polynomial fits to CE binding energy parameter (λ) as a function of radius shown for three example stellar models. The dashed lines in different colors indicate different ranges in which the fits have been made. The cyan diamond indicates the radius at which at least 10% of the mass of the envelope becomes convective, separating the first and the second fitted ranges. The background lines are colored according to the convective envelope mass fraction. The gray parts, where the radius was smaller than the maximum radius reached during the previous evolution, were not included in the fit.
Current usage metrics show cumulative count of Article Views (full-text article views including HTML views, PDF and ePub downloads, according to the available data) and Abstracts Views on Vision4Press platform.
Data correspond to usage on the plateform after 2015. The current usage metrics is available 48-96 hours after online publication and is updated daily on week days.
Initial download of the metrics may take a while.