Fig. 9
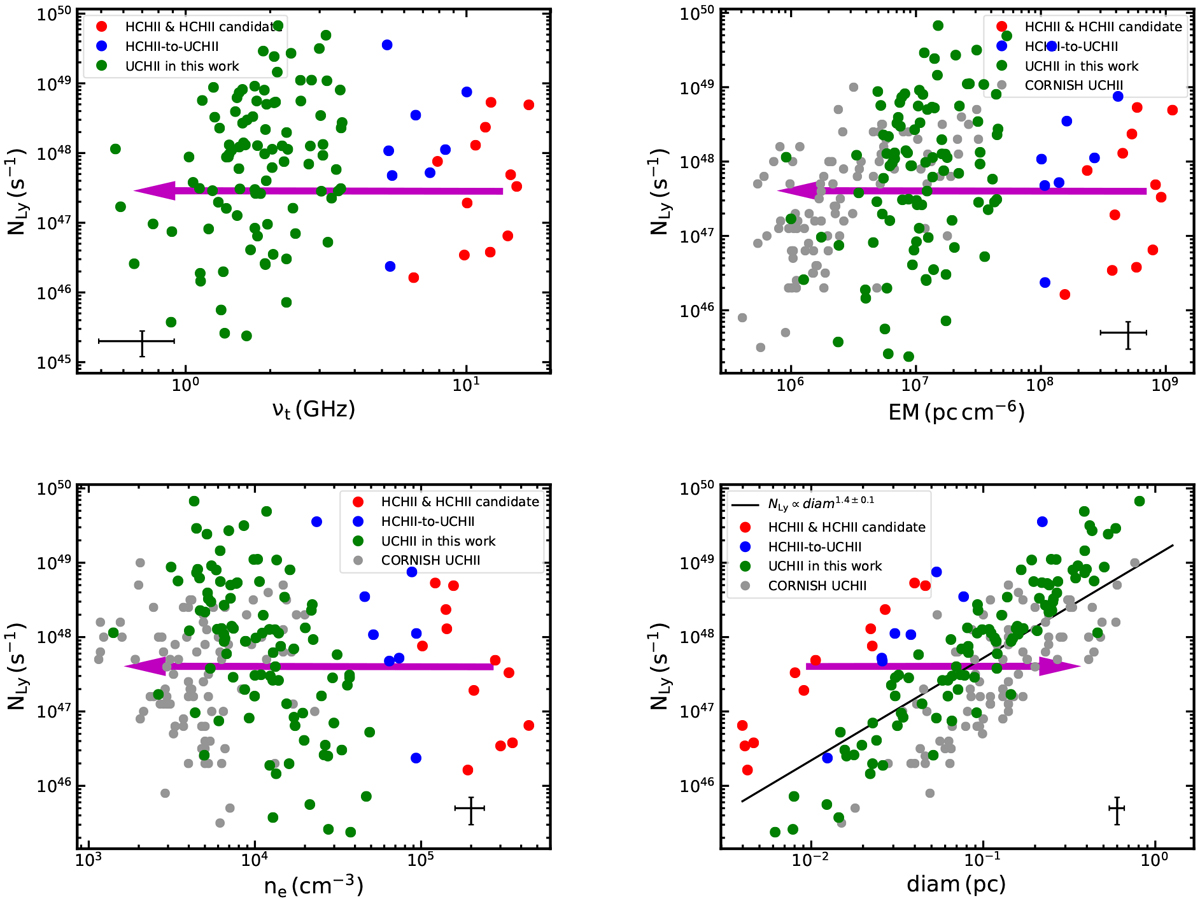
Plots of the evolution and correlation of the derived physical parameters. νt vs. NLy (upper-left), EM vs. NLy (upper-right), ne vs. NLy (bottom-left), and diam vs. NLy (bottom-right) for HC H II regions (red dots), intermediate objects between HC H II region and UC H II regions (blue), UC H II regions in this work (green dots), and CORNISH UC H II regions (gray dots). The CORNISH UC H II regions sample refers to the whole CORNISH UC H II regions sample from Kalcheva et al. (2018) by excluding UC H II regions in this work. The magenta arrow indicates the evolutionary trend of the physical properties.
Current usage metrics show cumulative count of Article Views (full-text article views including HTML views, PDF and ePub downloads, according to the available data) and Abstracts Views on Vision4Press platform.
Data correspond to usage on the plateform after 2015. The current usage metrics is available 48-96 hours after online publication and is updated daily on week days.
Initial download of the metrics may take a while.