Fig. 6
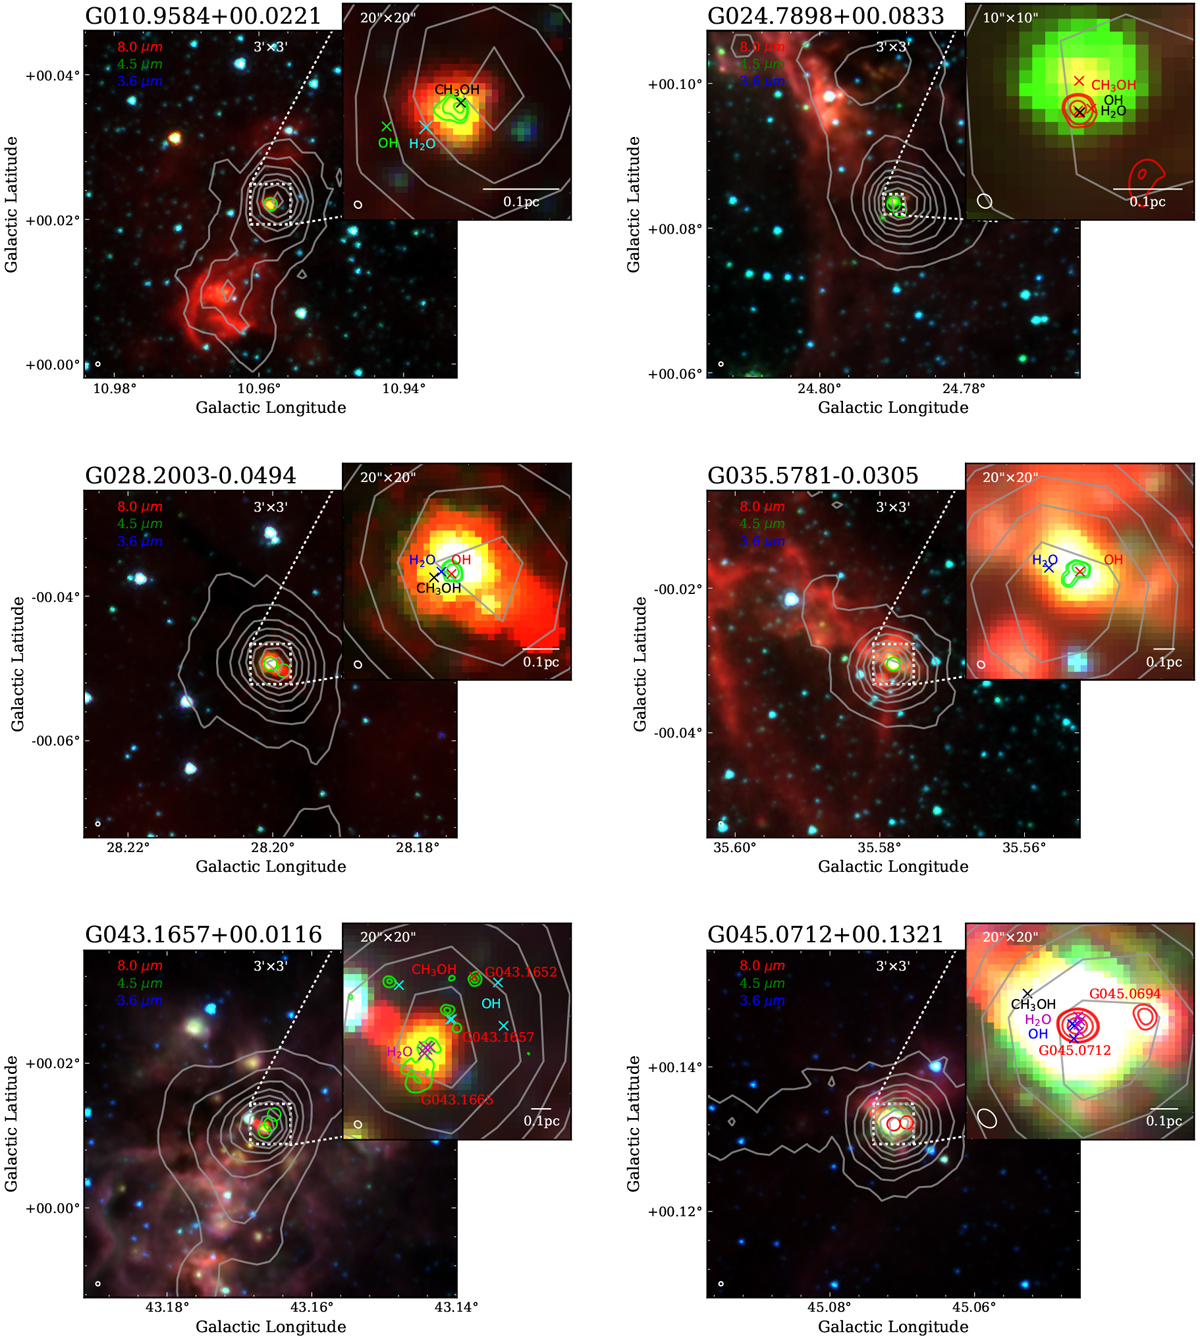
Three-color composition image (or RGB image) from Spitzer GLIMPSE 8 μm (red), 4.5 μm (green), and 3.6 μm (blue) bands (Benjamin et al. 2003; Churchwell et al. 2009) for the HC H II regions discussed in Sect. 4. Lime or red circles show the radio sources in the field from the CORNISH survey. The upper-right zoomed-in images for each panel show the peak position of H2 O maser (magenta cross) and OH maser (black cross), and the linear scale-bar of 0.1 pc in white. Gray contours in the image show 870 μm emission from ATLASGAL (Schuller et al. 2009), and the lime (or red) contours show K-band 22 GHz emission presented in this work. The red contours in the bottom-right panel show X-band 10 GHz emission as the K-band emission is missing for source G045.0694. The FWHM beam of GLIMPSE (2′′) and K-band observationsare indicated by the white circles shown in the lower-left corner of each image.
Current usage metrics show cumulative count of Article Views (full-text article views including HTML views, PDF and ePub downloads, according to the available data) and Abstracts Views on Vision4Press platform.
Data correspond to usage on the plateform after 2015. The current usage metrics is available 48-96 hours after online publication and is updated daily on week days.
Initial download of the metrics may take a while.