Fig. 5
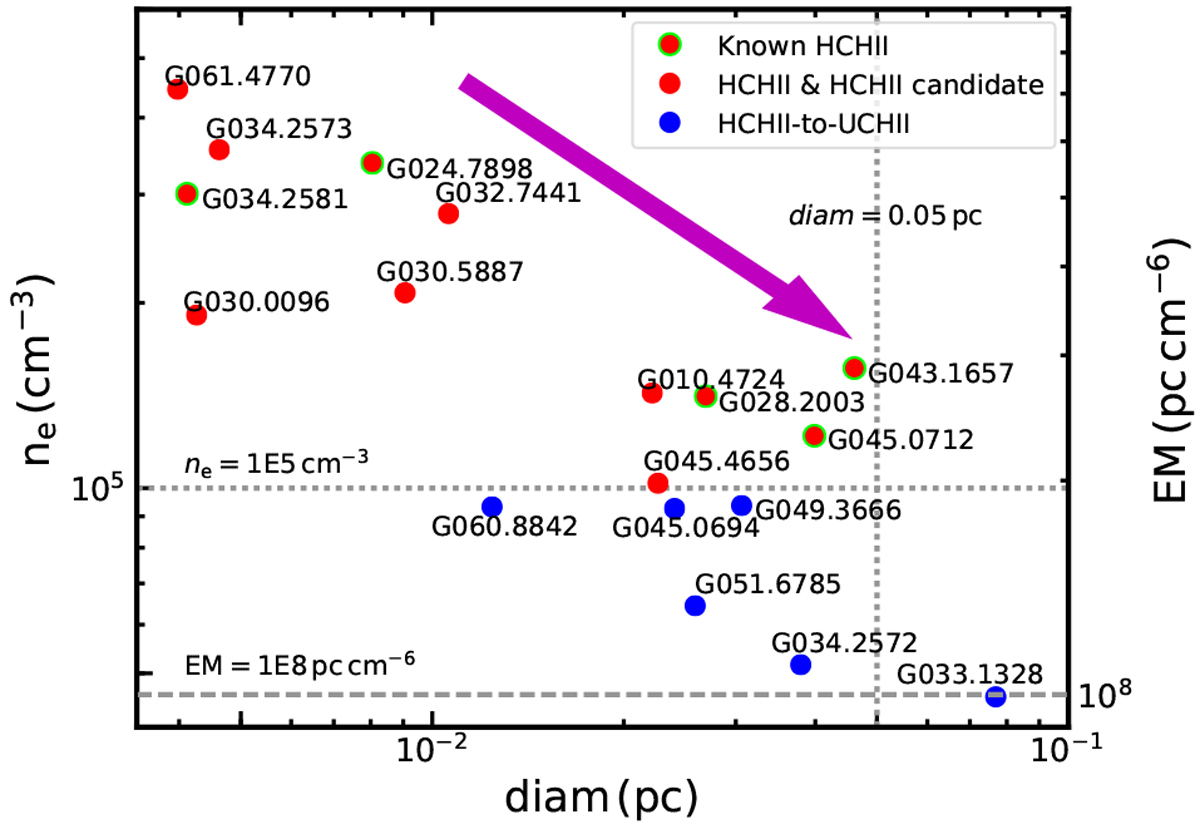
Distribution of properties of 18 optically thick HC H II regions identified in Sect. 4. The vertical and horizontal dotted and dashed lines indicate the standard quantitative criteria of an HC H II region. The red filled circles show HC H II regions and HC H II region candidates identified in this work while the red filled circles with lime circles identify the previously known HC H II regions. The filled blue circles show the intermediate objects between the HC H II andUC H II region stages. The magenta arrow shows the evolutionary trend.
Current usage metrics show cumulative count of Article Views (full-text article views including HTML views, PDF and ePub downloads, according to the available data) and Abstracts Views on Vision4Press platform.
Data correspond to usage on the plateform after 2015. The current usage metrics is available 48-96 hours after online publication and is updated daily on week days.
Initial download of the metrics may take a while.