Fig. 3
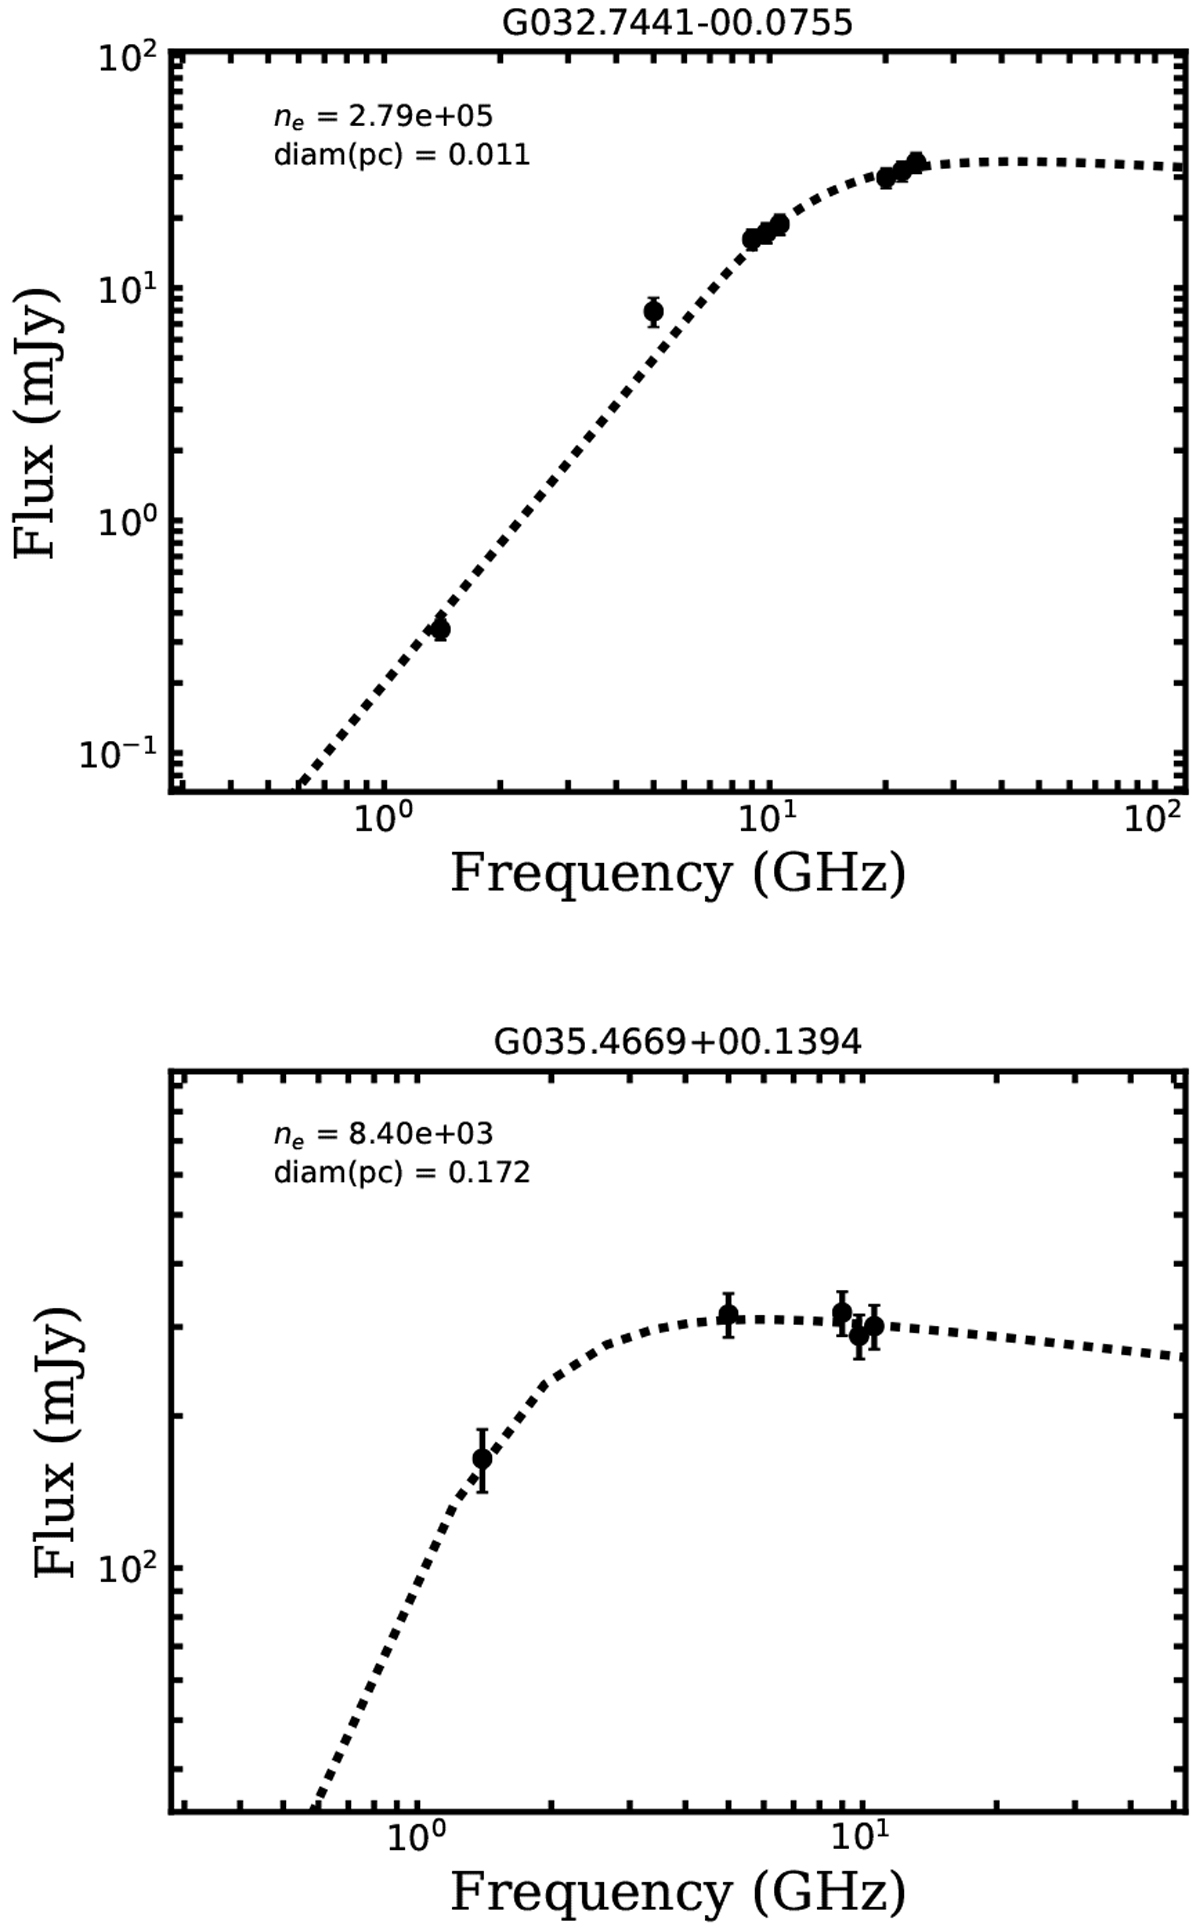
Radio SED fitting to flux density points for example compact and extended sources. Upper panel: SED fitting to flux density points between 1 and 26 GHz for the compact example G032.7441−00.0755 (upper row of Fig. 1). Lower panel: SED fitting to flux density points between 1 and 11 GHz for extended example G035.4669+00.1394 (middle row of Fig. 1) by excluding K-band flux measurements. The best-fitting results for the electron density ne and physical linear diameter diam are shown in the upper-left corner of each plot. The best-fitting SEDs for the whole sample are available in electronic form at the Zenodo via https://doi.org/10.5281/zenodo. 4293684.
Current usage metrics show cumulative count of Article Views (full-text article views including HTML views, PDF and ePub downloads, according to the available data) and Abstracts Views on Vision4Press platform.
Data correspond to usage on the plateform after 2015. The current usage metrics is available 48-96 hours after online publication and is updated daily on week days.
Initial download of the metrics may take a while.