Fig. 10
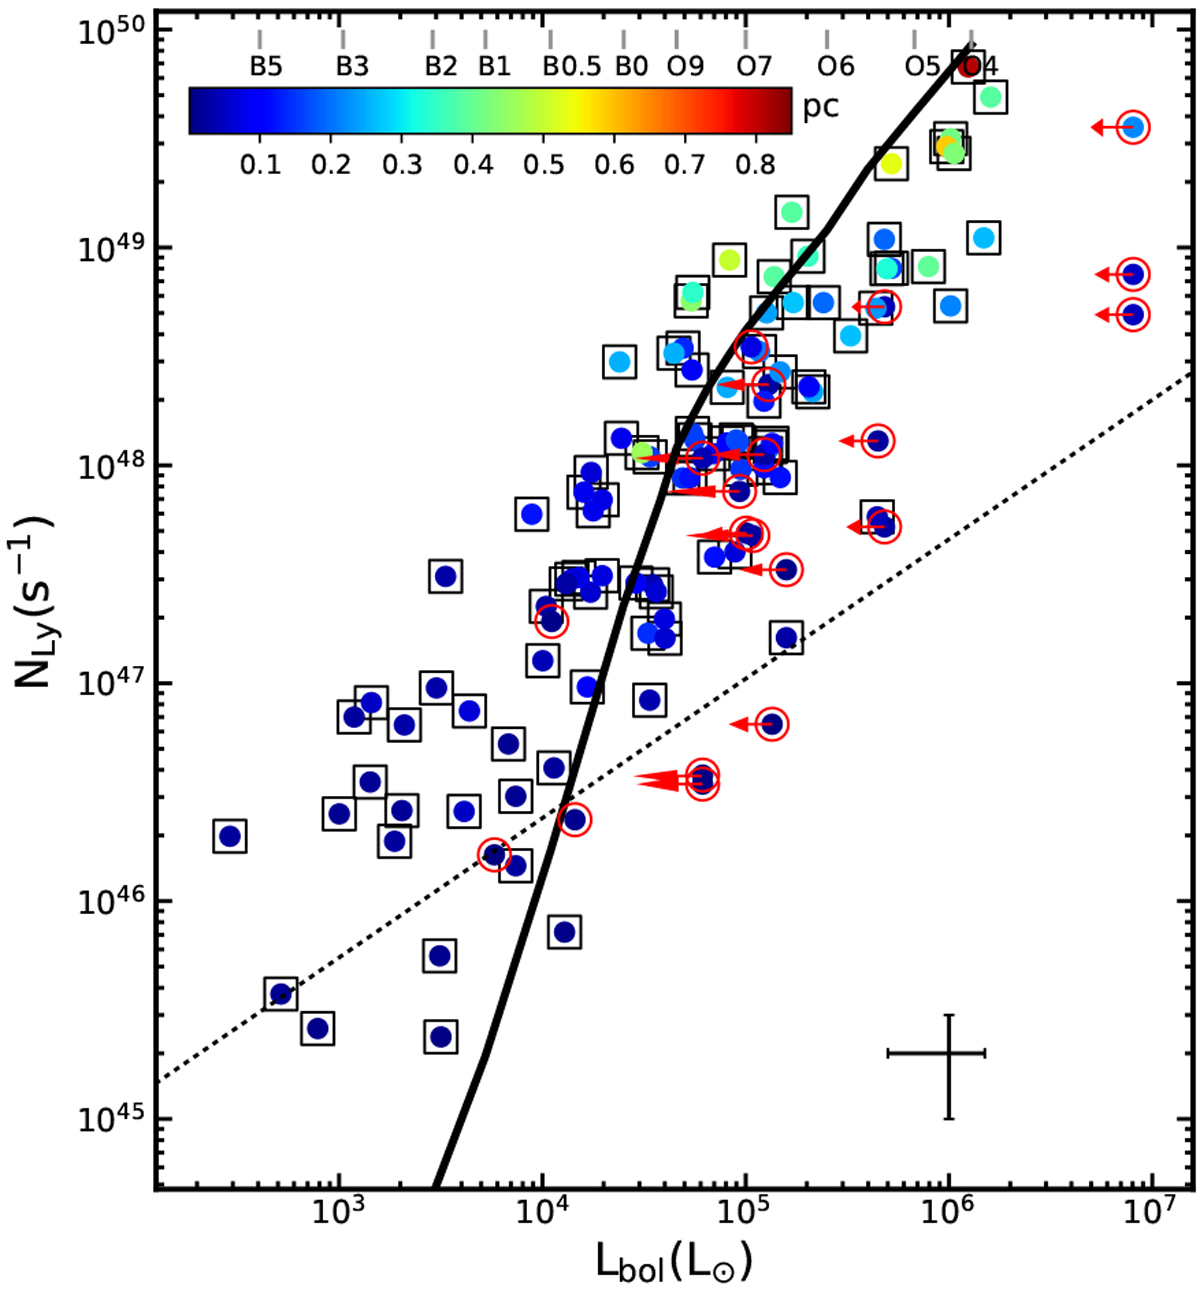
Lyman continuum flux NLy vs. the bolometric luminosity Lbol for young H II regions with rising spectra. The black solid line refers to the expected Lyman continuumphoton rate from a single ZAMS star of a given bolometric luminosity. The top axis lists the spectral type corresponding to a given bolometric luminosity taken from stellar models (Thompson 1984; Panagia 1973; Davies et al. 2011). The error bars in the bottom-right corner correspond to a 50% uncertainty for Lbol and NLy (Urquhart et al. 2018). At the top, we show the color bar for the physical size of the sources, indicating the physical diameter in parsecs. The red circles and black squares refer to optically thick H II regions (νt > 5 GHz) and optically thin H II regions (νt < 5 GHz). About 30% of the sample is located in the forbidden region above the solid curve considering a 50% uncertainty. The dotted line represents the empirical relation between Lbol and NLy for ionized jets from YSOs, with a power-law index of 0.64 derived by Purser et al. (2016). The red arrows for the optically thick H II regions indicate that the bolometric luminosities are upper limits due to the presence of other H II regions in the same clump.
Current usage metrics show cumulative count of Article Views (full-text article views including HTML views, PDF and ePub downloads, according to the available data) and Abstracts Views on Vision4Press platform.
Data correspond to usage on the plateform after 2015. The current usage metrics is available 48-96 hours after online publication and is updated daily on week days.
Initial download of the metrics may take a while.