Fig. 1
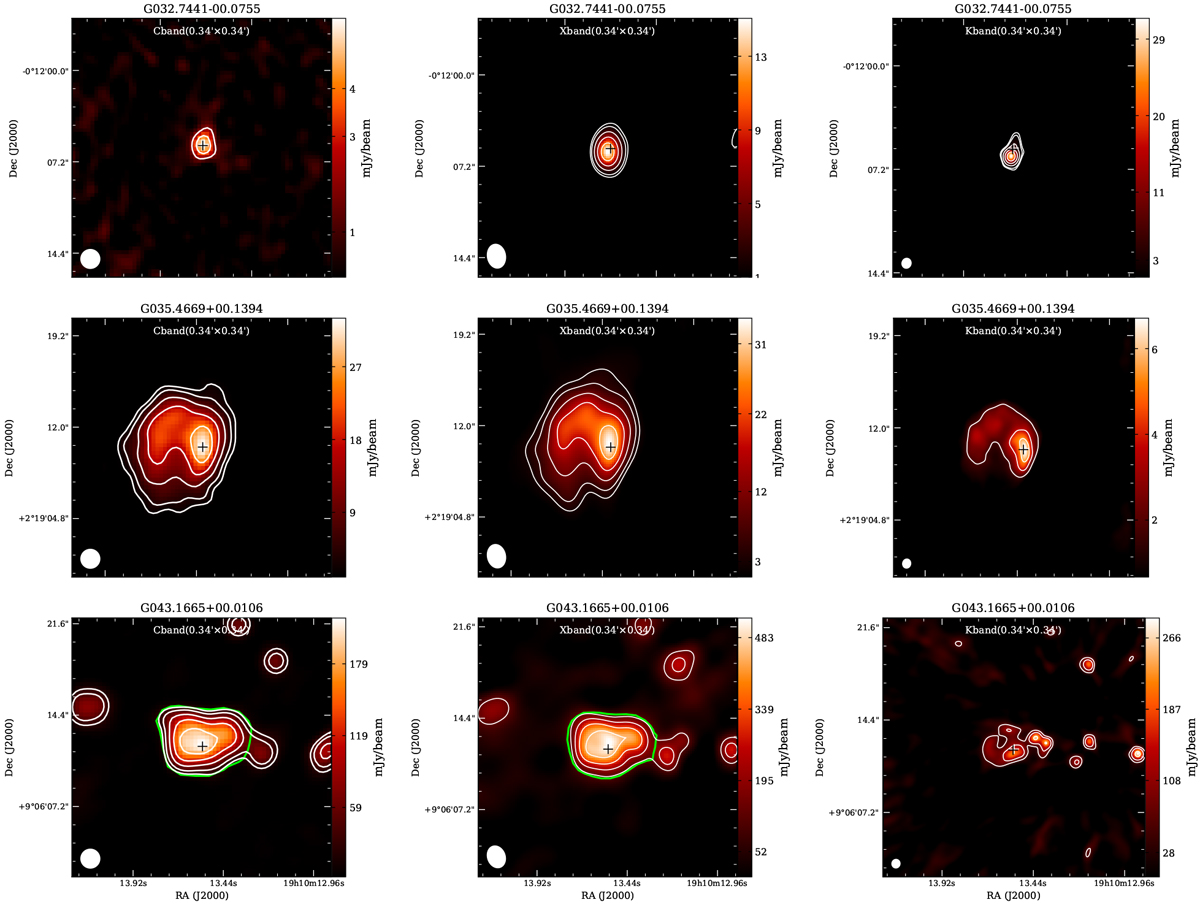
Example images of three radio sources at C-band (left-column), X-band (middle-column), and K-band (right-column). The position of the H II region is marked with a plus. Upper, middle, and lower rows: maps for the compact H II region G032.7441−00.0755, the extendedH ii region G035.4669+00.1394, and the H II region G043.1665+00.0106 located in a cluster (see Sect. 3.1), respectively. C-band images are from the CORNISH survey. The white contour levels of each image are equally spaced by 5σ and start at a level of 5σ. The green outline shown in the lower row shows the polygon that was manually drawn around the H II region located in acluster. The image size and beam size are shown in the upper-middle and lower-left of each image. The C-band, X-band, and K-band images for the whole sample are available in electronic form at the Zenodo via https://doi.org/10.5281/zenodo.4293684.
Current usage metrics show cumulative count of Article Views (full-text article views including HTML views, PDF and ePub downloads, according to the available data) and Abstracts Views on Vision4Press platform.
Data correspond to usage on the plateform after 2015. The current usage metrics is available 48-96 hours after online publication and is updated daily on week days.
Initial download of the metrics may take a while.