Open Access
Fig. 7.
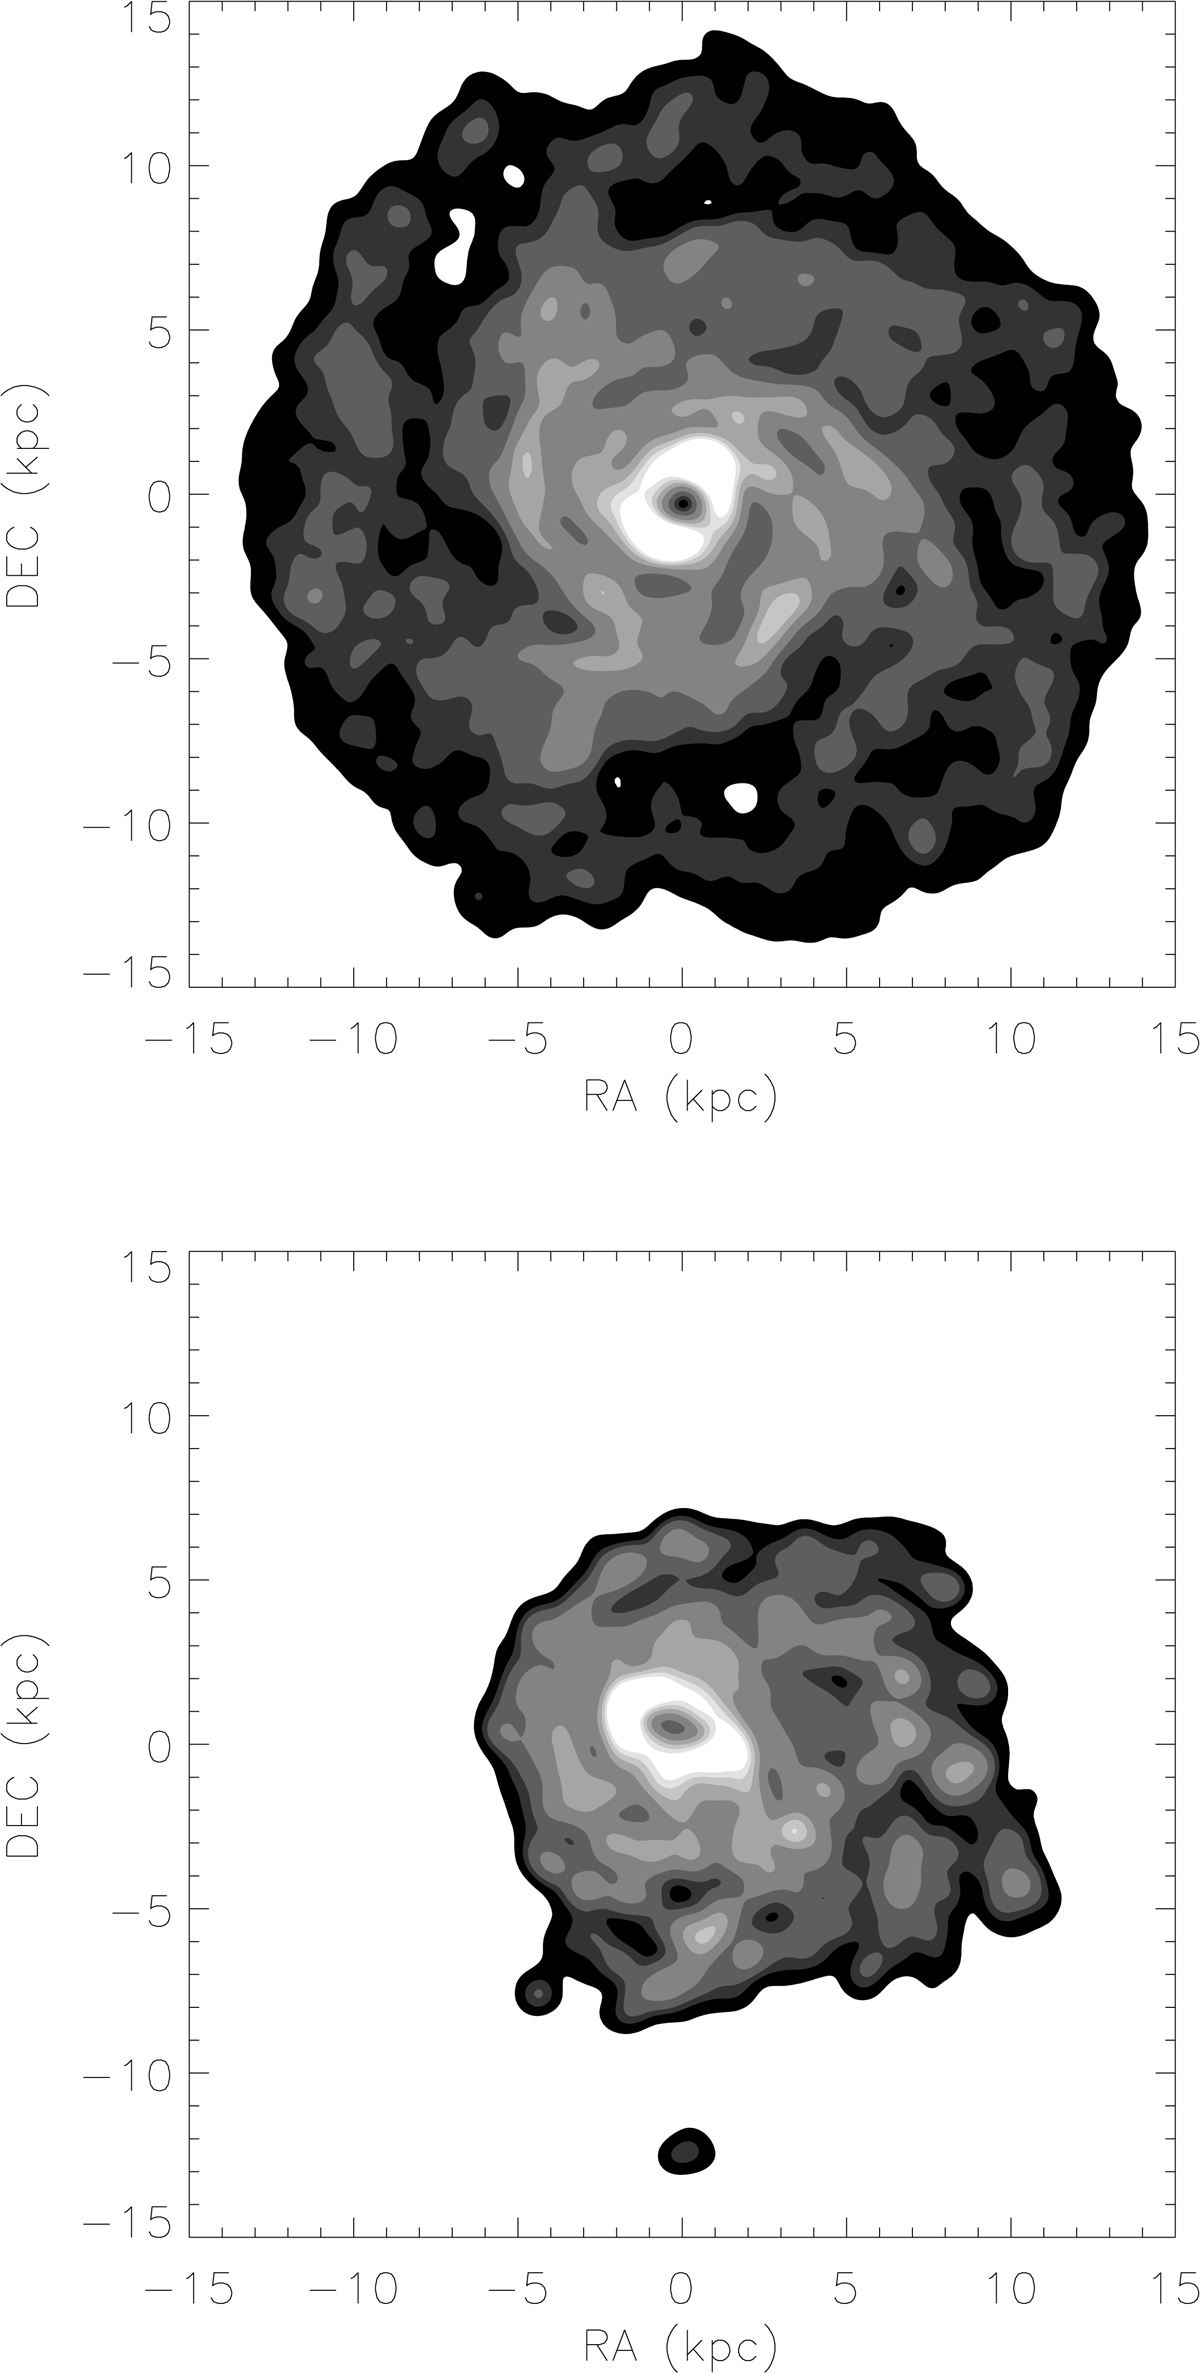
Face-on projection of the distribution of the total gas surface density at the beginning of the simulation (upper panel) and at Δt = −140 Myr (lower panel). The contours correspond to 1, 3, 5, 10, 20, 30, 40, and 50 M⊙ pc−2. The resolution is 820 pc.
Current usage metrics show cumulative count of Article Views (full-text article views including HTML views, PDF and ePub downloads, according to the available data) and Abstracts Views on Vision4Press platform.
Data correspond to usage on the plateform after 2015. The current usage metrics is available 48-96 hours after online publication and is updated daily on week days.
Initial download of the metrics may take a while.