Open Access
Fig. 3.
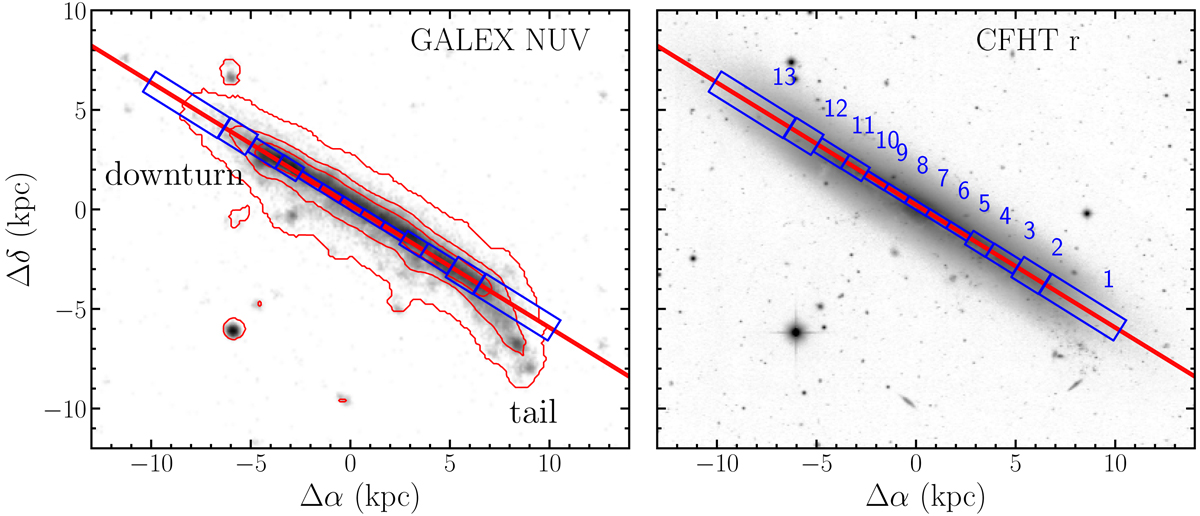
NGC 4330. Left panel: VLT slit position on the GALEX NUV image. Right panel: VLT slit position on the CFHT r band image adapted from Fossati et al. (2018). The downturn region includes slit regions 11 to 13, and the tail region includes slit regions 1–3. The downturn plus tail region includes slit regions 1–3 and 11–13.
Current usage metrics show cumulative count of Article Views (full-text article views including HTML views, PDF and ePub downloads, according to the available data) and Abstracts Views on Vision4Press platform.
Data correspond to usage on the plateform after 2015. The current usage metrics is available 48-96 hours after online publication and is updated daily on week days.
Initial download of the metrics may take a while.