Fig. C.2.
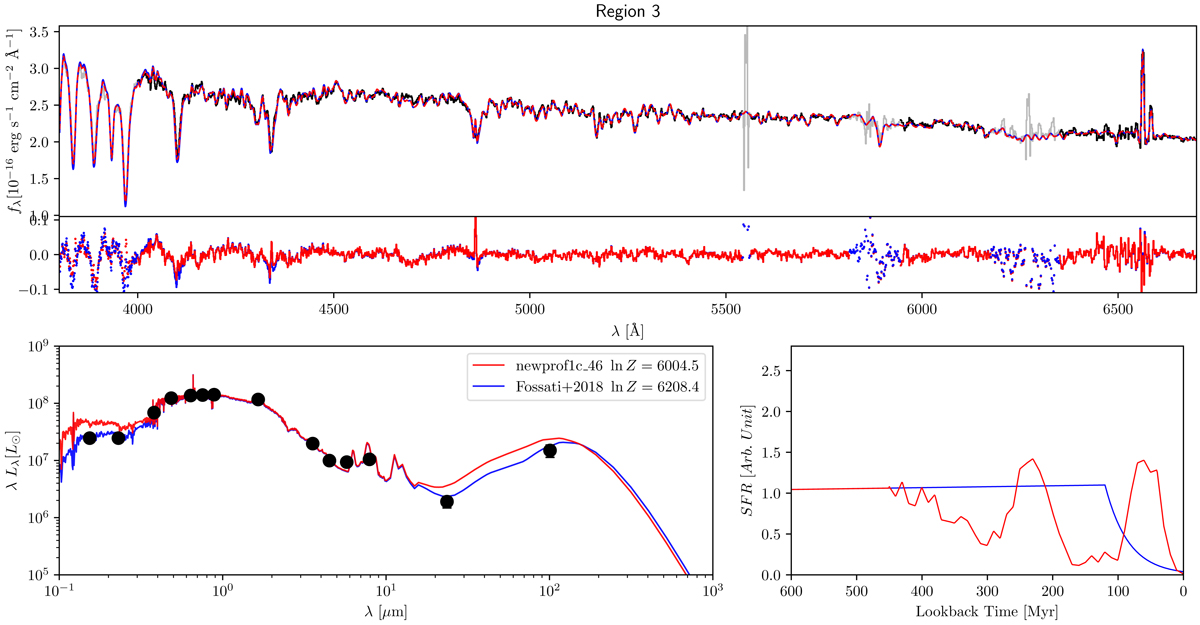
Model 1cnew_46, region 3. The total goodness is g = 6004, Δg = 178 less than the total goodness of model 4new_47 (Fig. A.6). Upper panel: FORS2 spectrum (black), Fossati et al. model (blue), and model 1cnew_46 (red). Middle panel: fit residuals. Lower-left panel: observed SED (black), Fossati et al. model (blue), and model 1cnew_46 (red). Lower-right panel: SFH, Fossati et al. model (blue), and model 1cnew_46 (red).
Current usage metrics show cumulative count of Article Views (full-text article views including HTML views, PDF and ePub downloads, according to the available data) and Abstracts Views on Vision4Press platform.
Data correspond to usage on the plateform after 2015. The current usage metrics is available 48-96 hours after online publication and is updated daily on week days.
Initial download of the metrics may take a while.