Fig. 1.
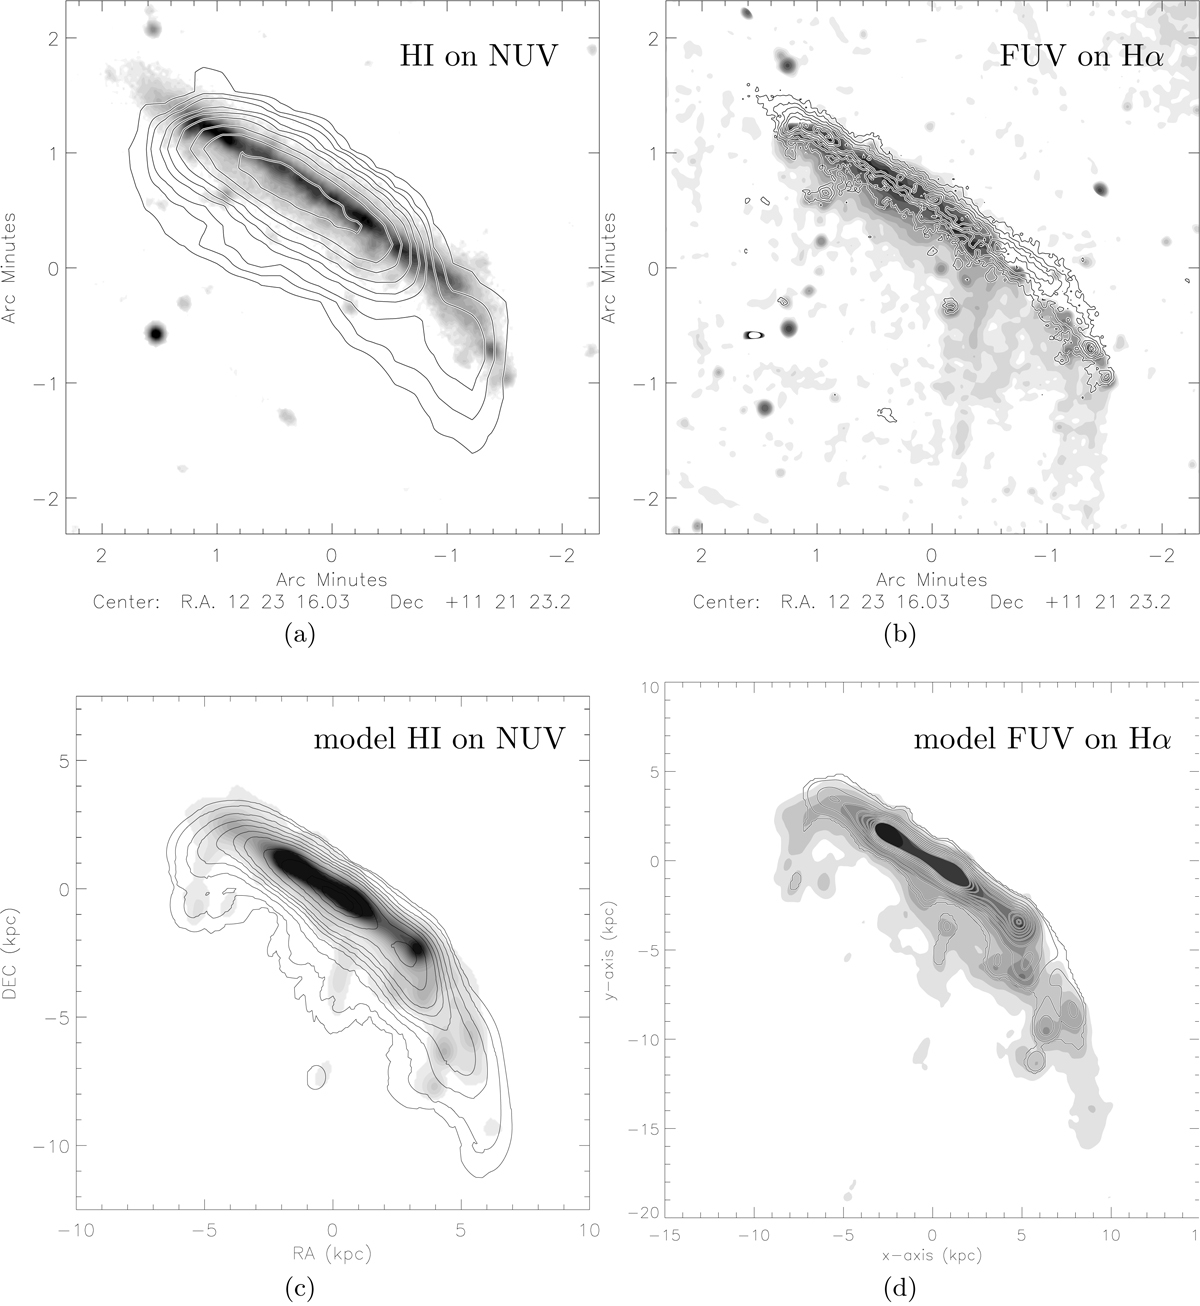
NGC 4330. Upper-left panel: VIVA survey H I emission distribution (contours) on the GALEX NUV image. Upper-right panel: GALEX FUV emission distribution (contours) on the VESTIGE continuum-subtracted Hα+[NII] image. Lower-left panel: model HI emission distribution (contours) on the model extinction-free NUV image. Lower-right panel: model FUV emission distribution (contours) on the model extinction-free Hα image.
Current usage metrics show cumulative count of Article Views (full-text article views including HTML views, PDF and ePub downloads, according to the available data) and Abstracts Views on Vision4Press platform.
Data correspond to usage on the plateform after 2015. The current usage metrics is available 48-96 hours after online publication and is updated daily on week days.
Initial download of the metrics may take a while.