Fig. 8.
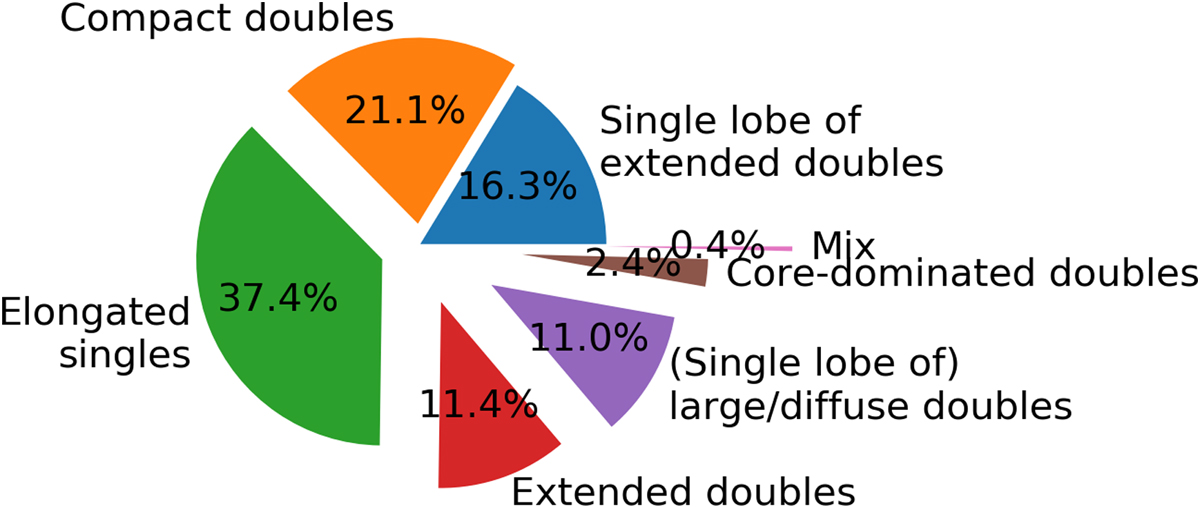
Piechart of dominant groups in the 10 × 10 cyclic SOM, providing a rough indication of the percentage of sources best matching a neuron in each group. The number of sources best matching a neuron that belonged to two groups was counted half for the tally in each group. These are first-order estimates: each group will contain sources that a human will classify differently after individual inspection.
Current usage metrics show cumulative count of Article Views (full-text article views including HTML views, PDF and ePub downloads, according to the available data) and Abstracts Views on Vision4Press platform.
Data correspond to usage on the plateform after 2015. The current usage metrics is available 48-96 hours after online publication and is updated daily on week days.
Initial download of the metrics may take a while.