Fig. 4.
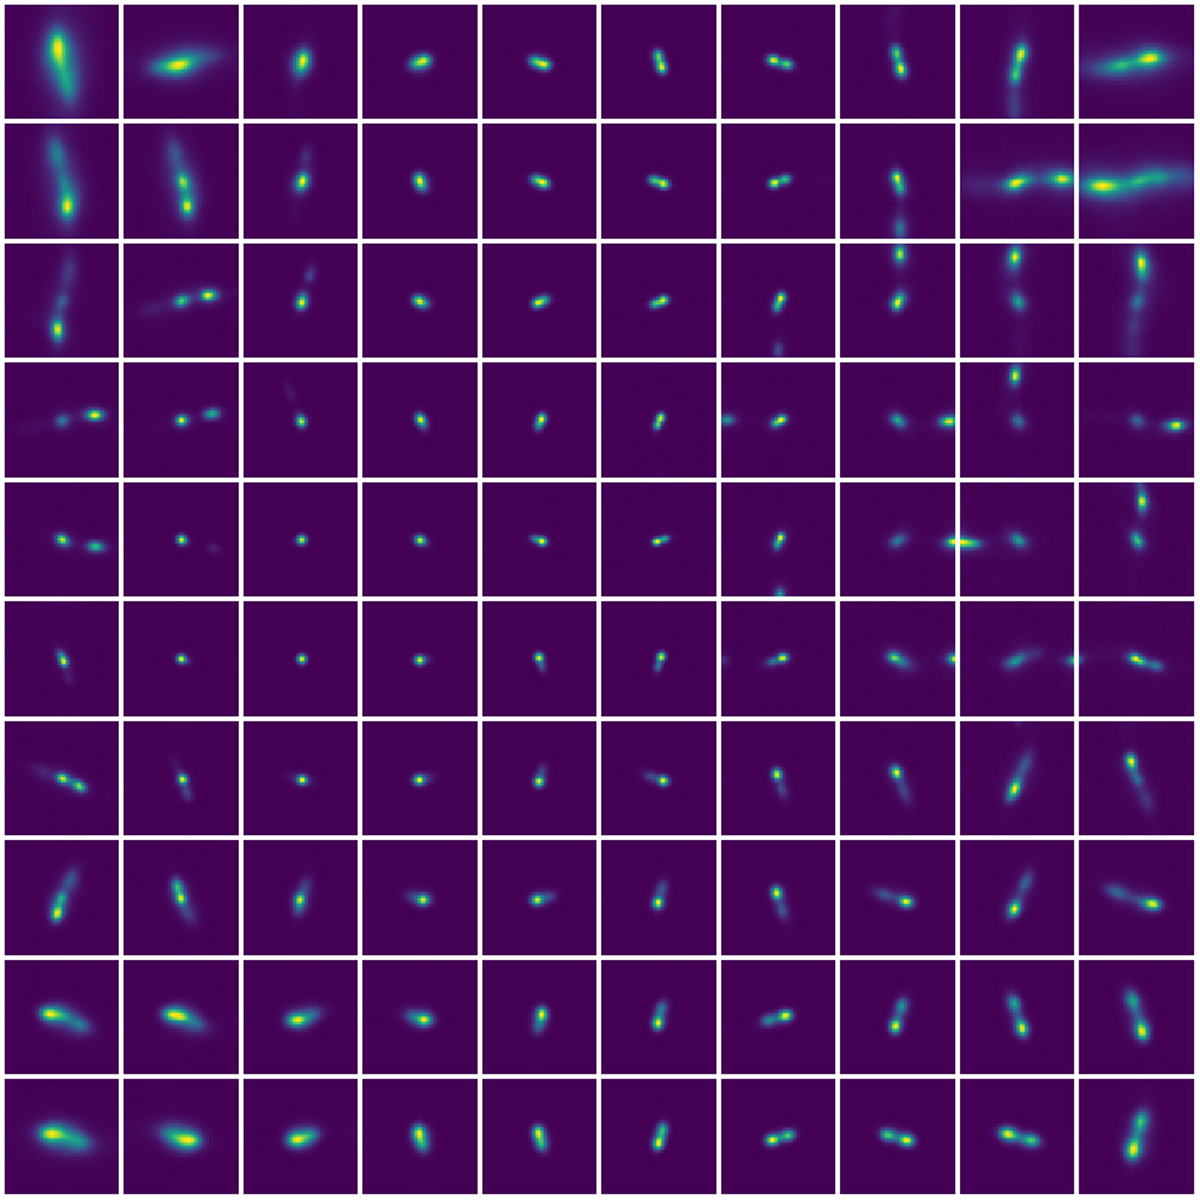
Final 10 × 10 cyclic SOM. Each one of the 100 representative images represents a cluster of similar morphologies present in the training dataset. Topology across the representative images is well conserved: Similar shaped representative images are close to each other in the SOM. We note that the SOM is cyclic, the representative images at the right border are connected to those at the left and the representative images at the bottom are connected to the representative images at the top.
Current usage metrics show cumulative count of Article Views (full-text article views including HTML views, PDF and ePub downloads, according to the available data) and Abstracts Views on Vision4Press platform.
Data correspond to usage on the plateform after 2015. The current usage metrics is available 48-96 hours after online publication and is updated daily on week days.
Initial download of the metrics may take a while.