Fig. A.1.
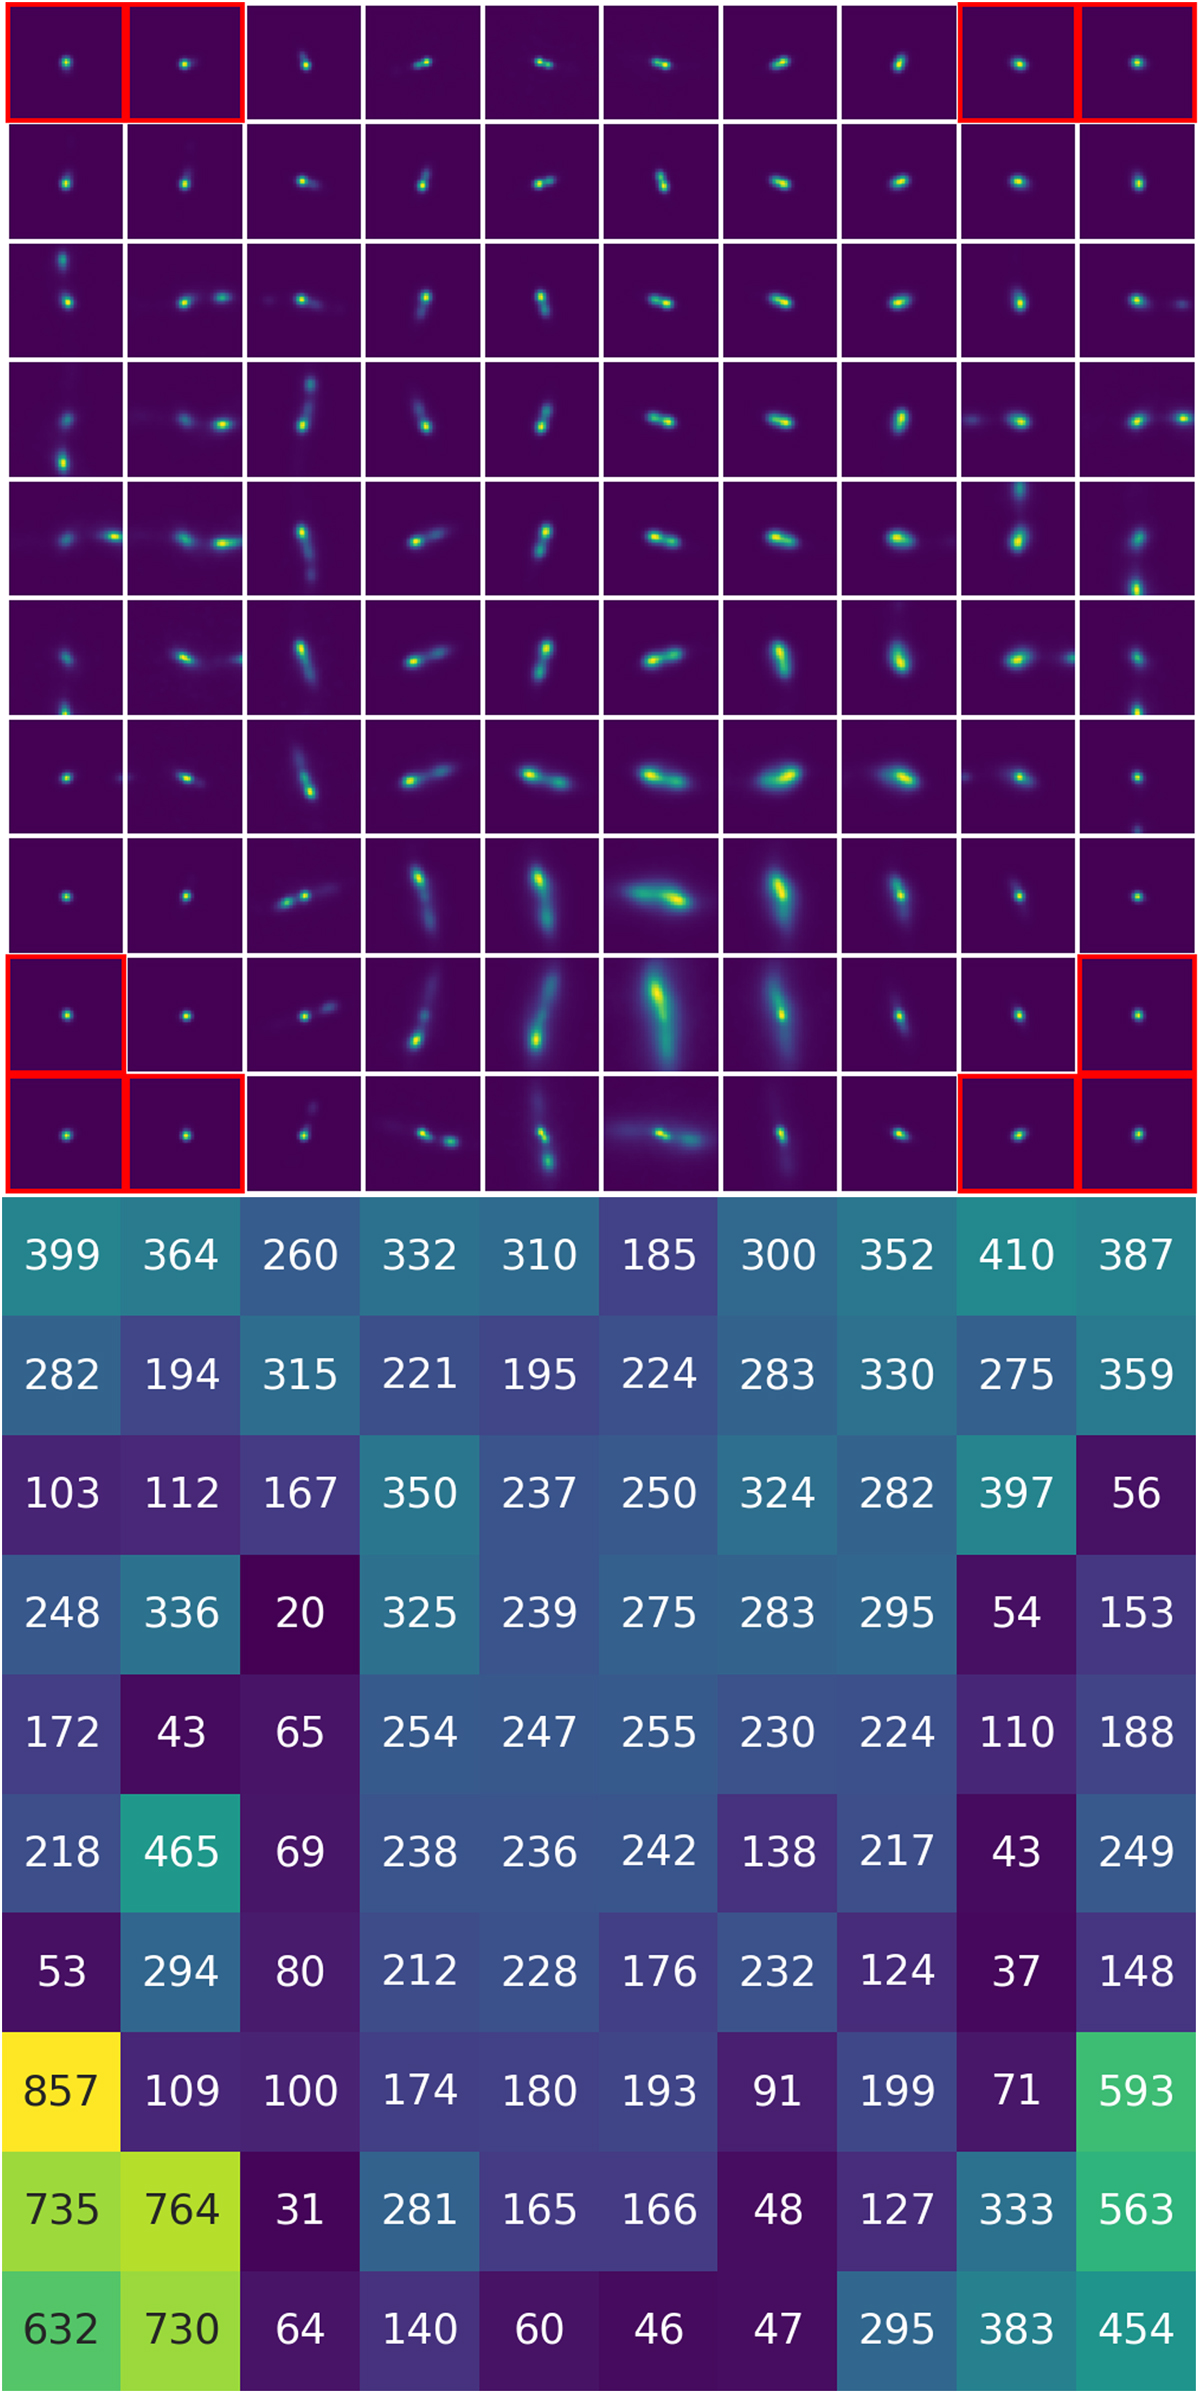
Top panel: first run 10 × 10 cyclic SOM. The first run reveals that our preprocessed dataset still contains a large fraction of unresolved sources. We remove these from the training dataset by removing all radio sources that map to one of the red highlighted representative images. Bottom panel: heatmap of the first run SOM, indicating the number of sources mapped to each of the representative images.
Current usage metrics show cumulative count of Article Views (full-text article views including HTML views, PDF and ePub downloads, according to the available data) and Abstracts Views on Vision4Press platform.
Data correspond to usage on the plateform after 2015. The current usage metrics is available 48-96 hours after online publication and is updated daily on week days.
Initial download of the metrics may take a while.