Fig. 10.
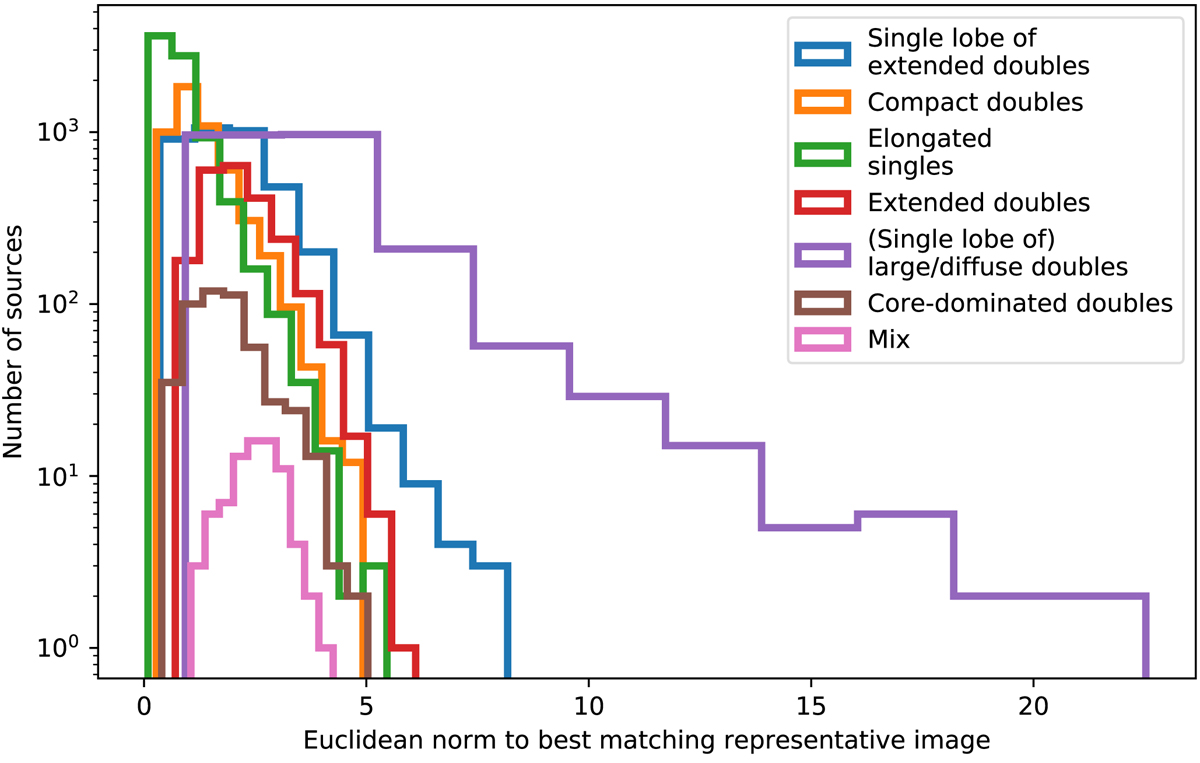
Histogram of Euclidean norm from each radio source to its closest representative image in the final 10 × 10 cyclic SOM, aggregated by group. This shows how well each source resembles the best matching representative image in its group. The lower the Euclidean norm, the better the match. In general, a steeper declining trend indicates a better match across sources with the same label.
Current usage metrics show cumulative count of Article Views (full-text article views including HTML views, PDF and ePub downloads, according to the available data) and Abstracts Views on Vision4Press platform.
Data correspond to usage on the plateform after 2015. The current usage metrics is available 48-96 hours after online publication and is updated daily on week days.
Initial download of the metrics may take a while.