Open Access
Fig. 6.
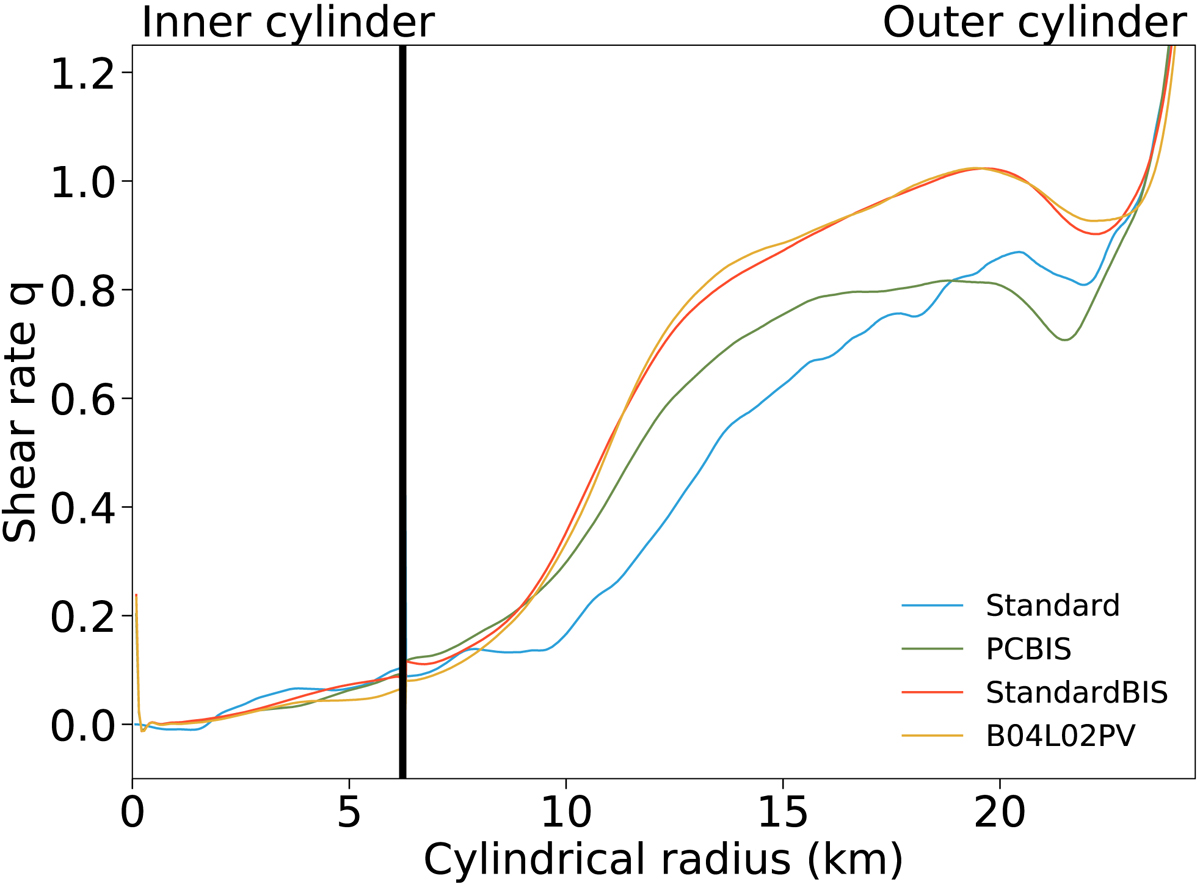
Comparison of the vertically and azimuthally averaged shear rate q inside the PNS for different MHD simulations as a function of the cylindrical radius. The values are time-averaged in the quasi-stationary phase of the dynamo. The black line represents the radius of the inner core ri.
Current usage metrics show cumulative count of Article Views (full-text article views including HTML views, PDF and ePub downloads, according to the available data) and Abstracts Views on Vision4Press platform.
Data correspond to usage on the plateform after 2015. The current usage metrics is available 48-96 hours after online publication and is updated daily on week days.
Initial download of the metrics may take a while.