Fig. 3.
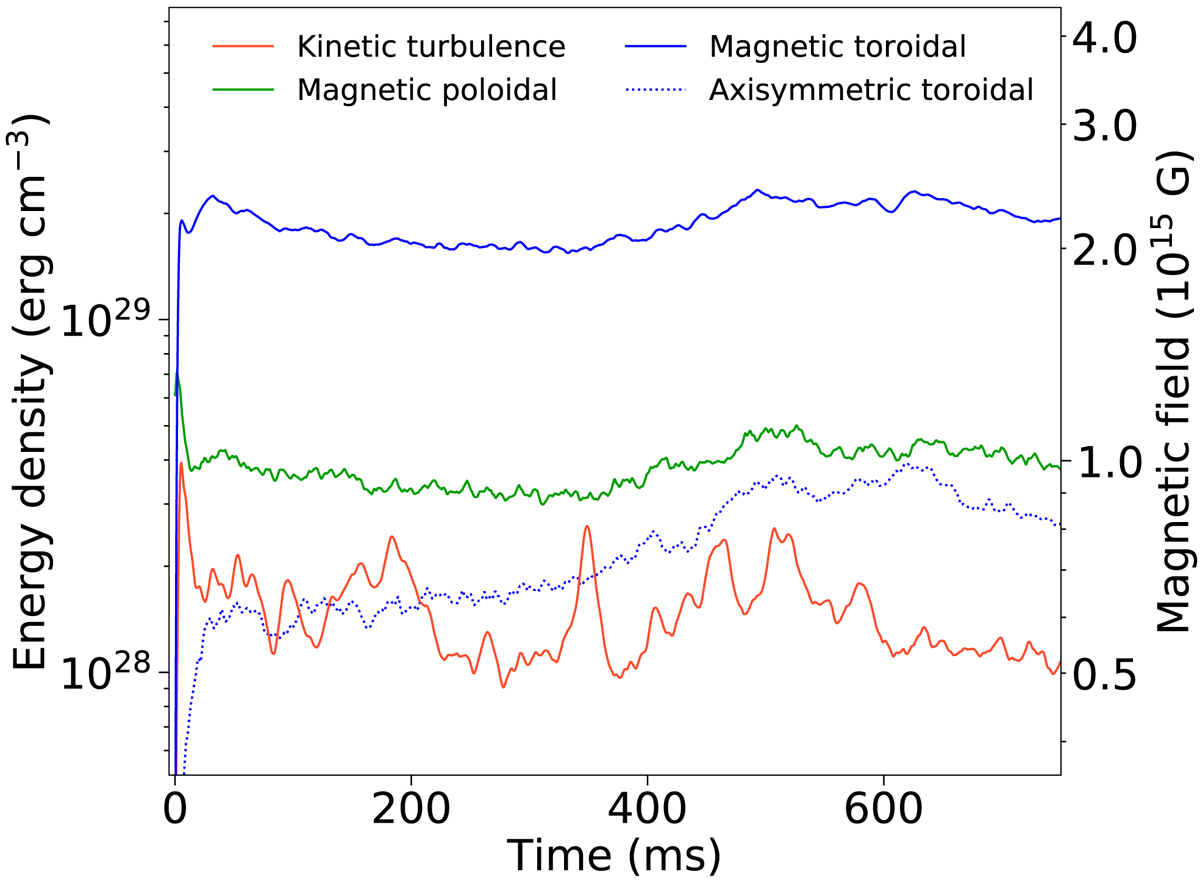
Temporal evolution of the magnetic and turbulent kinetic energy density for the model StandardB0 = 8.8 × 10¹⁴ G, [Lmin, Lmax]=[0.23 ro, 0.38 ro]. The blue and green lines are the toroidal and poloidal contributions of the magnetic energy density, while the orange line is the turbulent kinetic energy density (axisymmetric toroidal contribution is removed). The blue dotted line is the axisymmetric contribution to the toroidal magnetic energy density.
Current usage metrics show cumulative count of Article Views (full-text article views including HTML views, PDF and ePub downloads, according to the available data) and Abstracts Views on Vision4Press platform.
Data correspond to usage on the plateform after 2015. The current usage metrics is available 48-96 hours after online publication and is updated daily on week days.
Initial download of the metrics may take a while.