Fig. 6
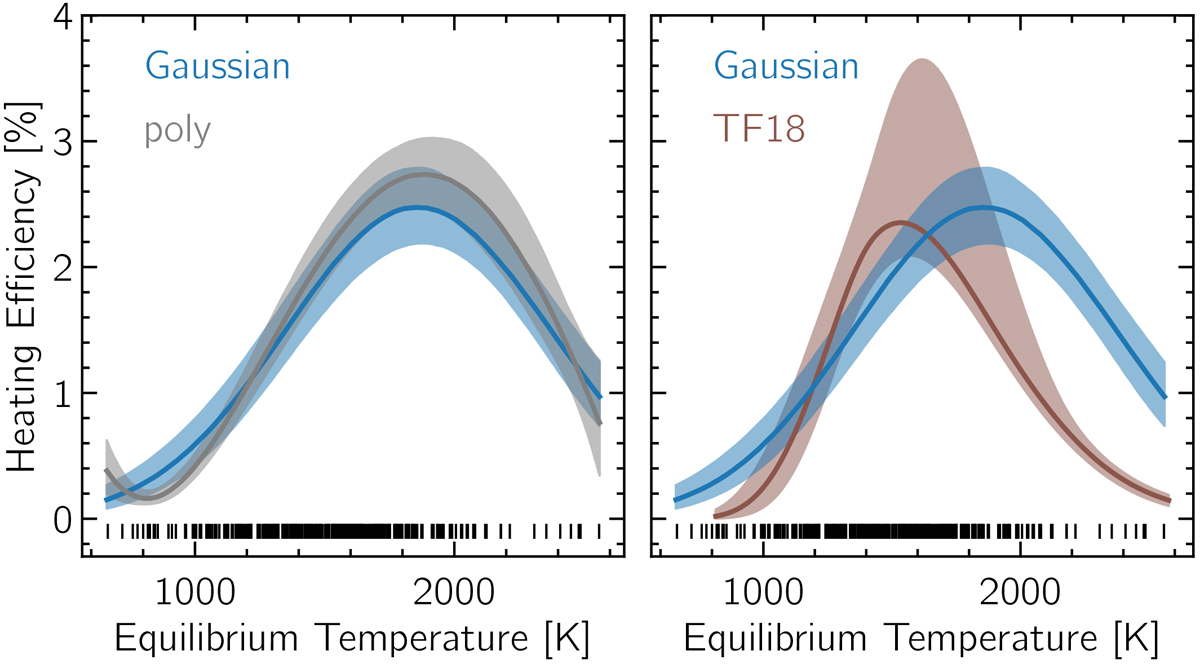
Left: heating efficiency–equilibrium temperature (HEET) posterior distribution under the linear-uniform prior using a Gaussian function and a 4th degree polynomial. Right: the Gaussian function shown on the left side in comparison to the HEET posterior distribution inferred by TF18. The shaded region show the 68% credible interval. There is a good agreement between the Gaussian and poly models, which shows that indeed the HEET distribution follows a Gaussian function. Our results are in agreement with the findings of TF18 although the peak in our models is shifted to higher equilibrium temperatures.
Current usage metrics show cumulative count of Article Views (full-text article views including HTML views, PDF and ePub downloads, according to the available data) and Abstracts Views on Vision4Press platform.
Data correspond to usage on the plateform after 2015. The current usage metrics is available 48-96 hours after online publication and is updated daily on week days.
Initial download of the metrics may take a while.