Fig. 4
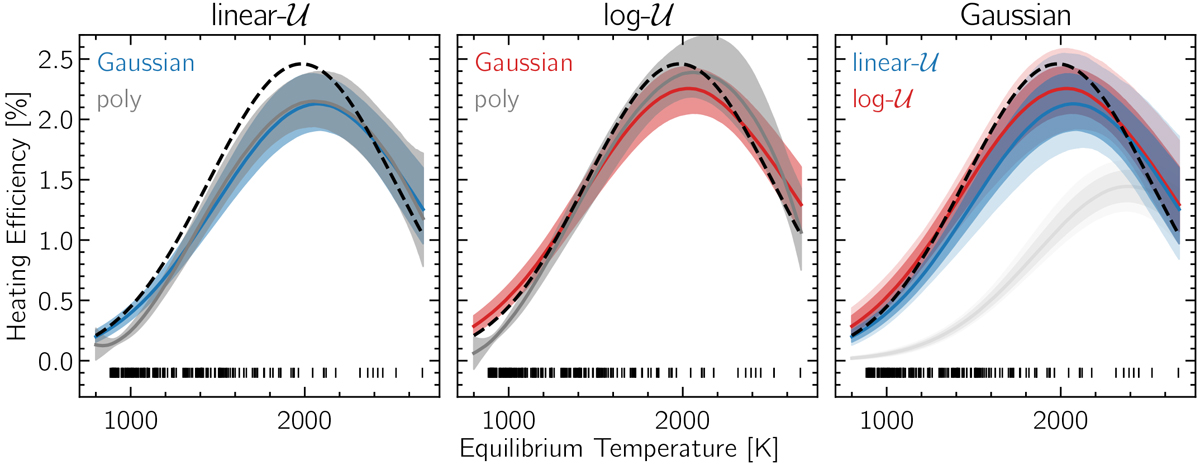
Model validation on planet population synthesis data. Heating efficiency – equilibrium temperature (HEET) posterior distribution using the linear-uniform (left) and the log-uniform (middle) priors for a Gaussian and 4th degree polynomial. The thick lines denotes the posterior median for the relevant functions and the dashed black line denotesthe true distribution implemented in the Bern population synthesis model, which was used to generate the synthetic data. The dark and light shaded region contains the 68 and 90% credible interval. To better compare the same model using different priors, the right panel shows the Gaussian models using log (red) and linear (blue) uniform priors. The light gray model in the right panel is the inferred posterior distribution in case we do not correct for the choice of prior. Our model is able to retrieve the Gaussian-like function when modeled using a 4th degree polynomial. The posterior median provides a good fit to the true distribution although the linear model predicts a lower heating efficiency. The credible intervals derived are able to accurately constrain the true values of the model parameters.
Current usage metrics show cumulative count of Article Views (full-text article views including HTML views, PDF and ePub downloads, according to the available data) and Abstracts Views on Vision4Press platform.
Data correspond to usage on the plateform after 2015. The current usage metrics is available 48-96 hours after online publication and is updated daily on week days.
Initial download of the metrics may take a while.