Fig. 9.
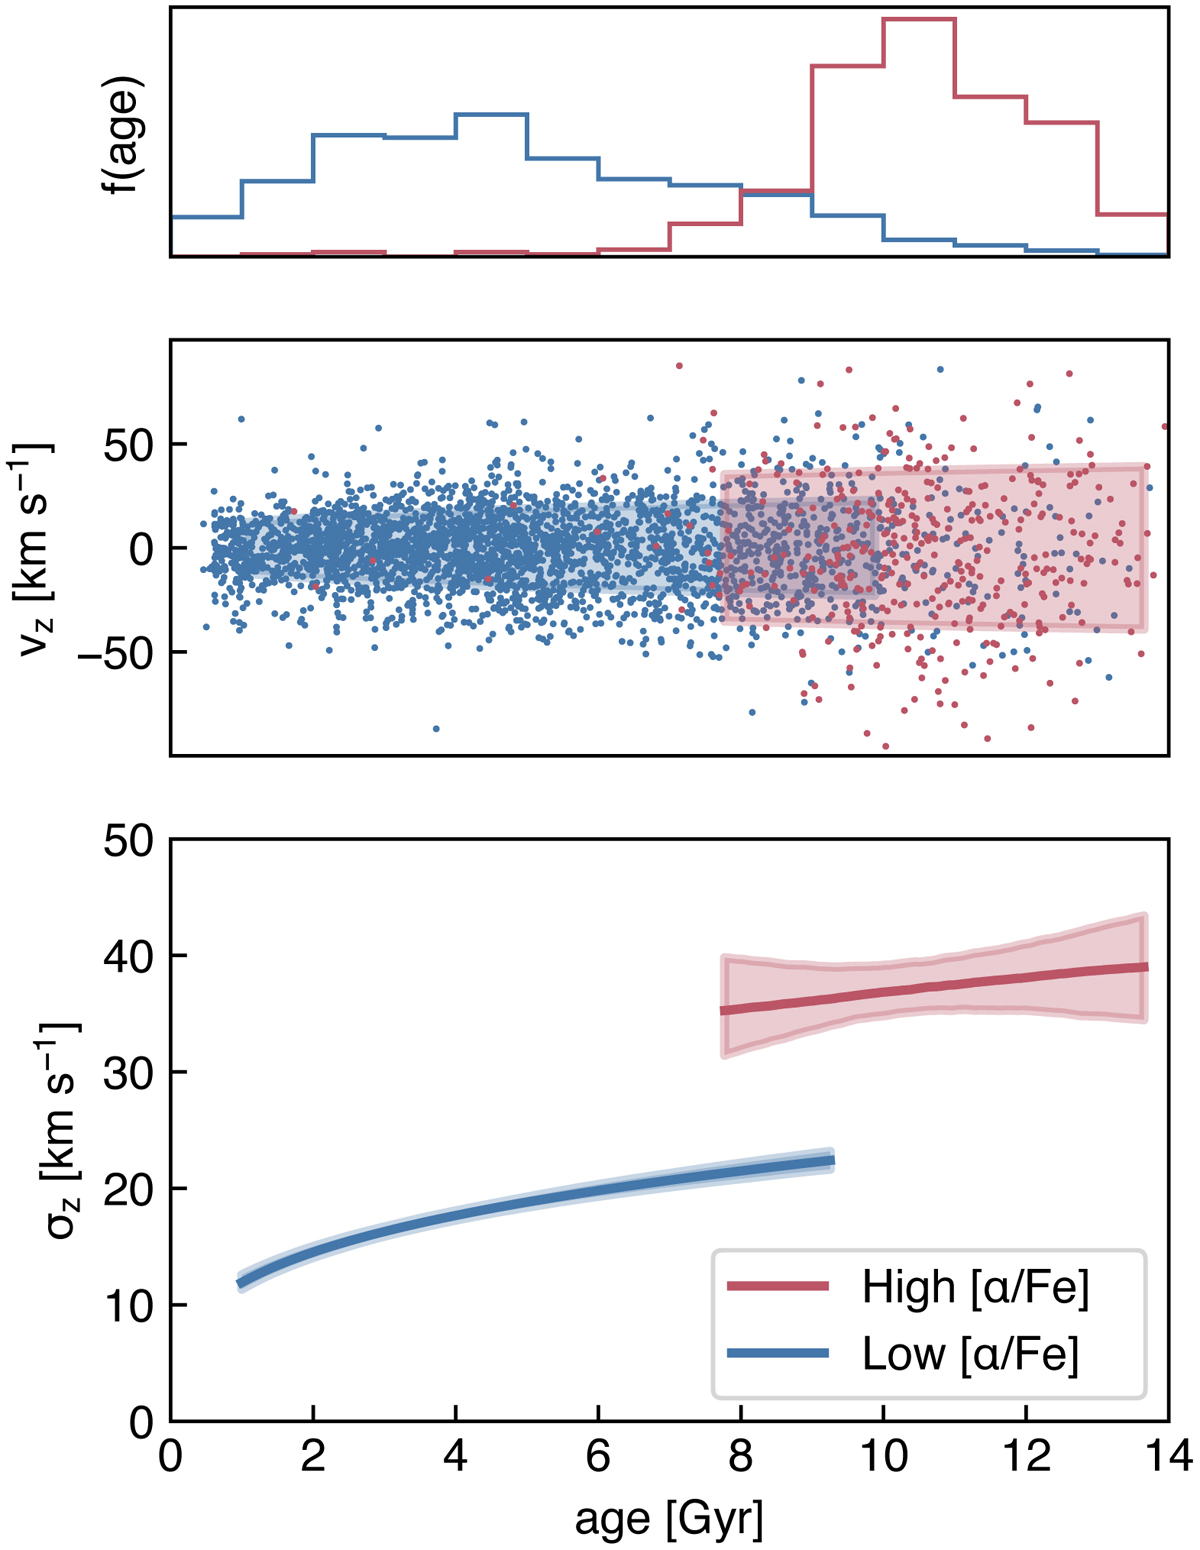
Vertical (σz) velocity dispersion as a function of age. Middle panel: best-fit models for the AVR of the low- and high-[Mg/Fe] selection in age-vz space, compared with the data used in the fit. Lower panel: AVRs themselves, and upper panel: age distribution of the [α/Fe] selected populations. Blue and red lines represent the best fit power-law models for stars in the low- and high-α sequence, respectively. The coloured bands in the lower panel show the 5th to 95th percentile credible intervals of the inferred σz−age relation. The AVR for each population is only shown in the range of the 0.05 and 0.95 quantile of its ages.
Current usage metrics show cumulative count of Article Views (full-text article views including HTML views, PDF and ePub downloads, according to the available data) and Abstracts Views on Vision4Press platform.
Data correspond to usage on the plateform after 2015. The current usage metrics is available 48-96 hours after online publication and is updated daily on week days.
Initial download of the metrics may take a while.