Fig. B.1.
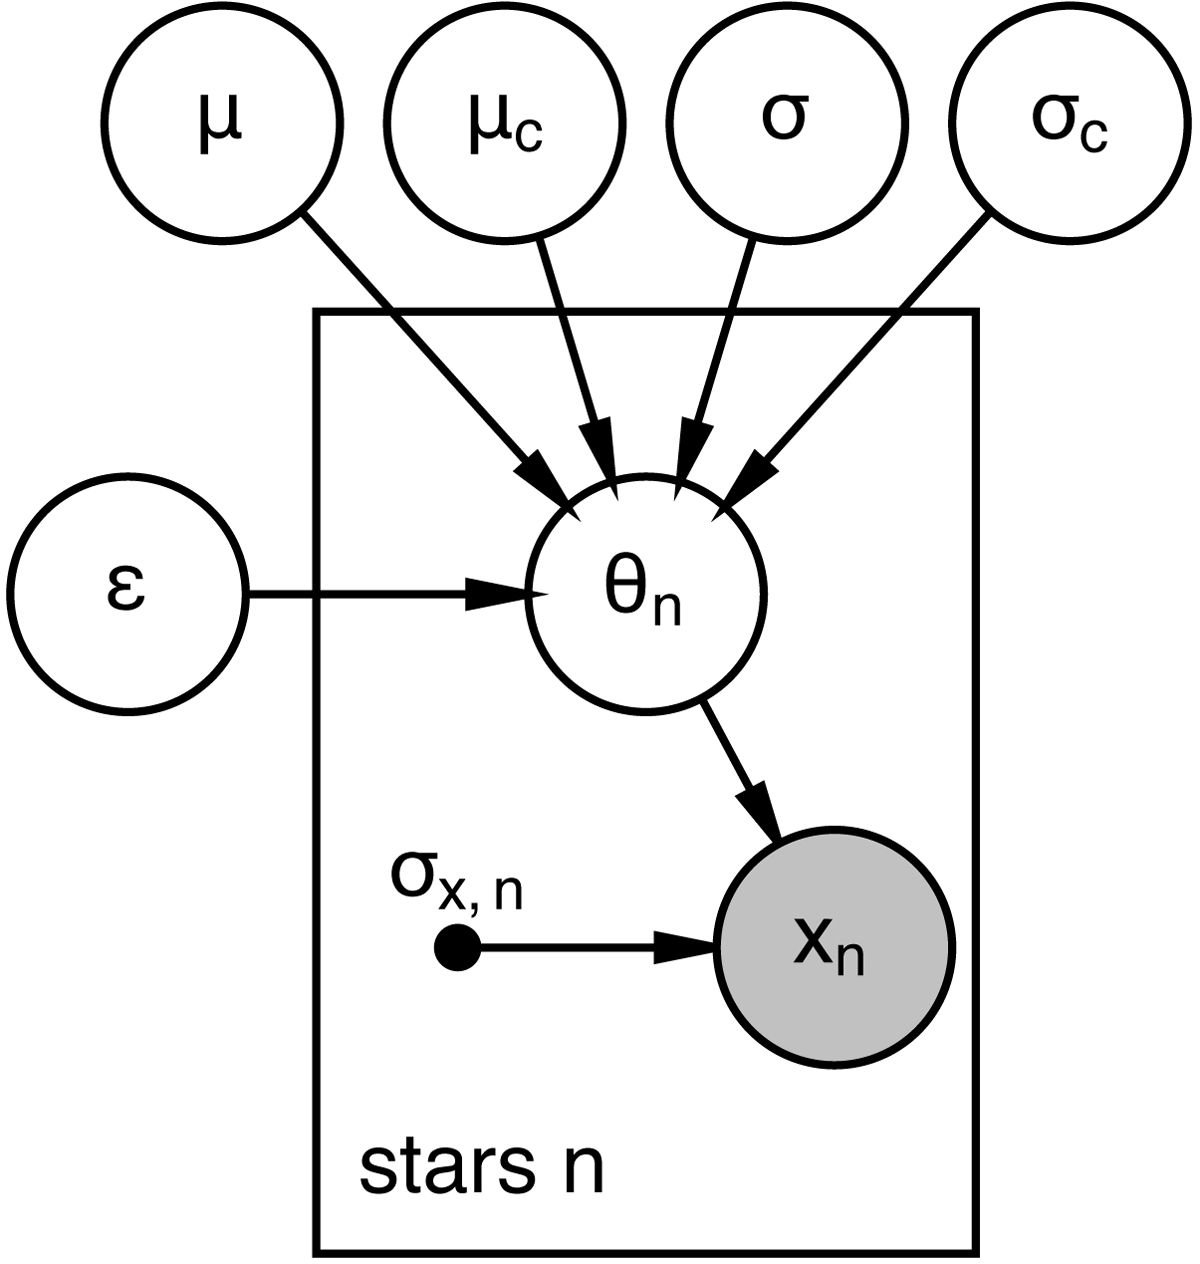
Probabilistic graphical model used to fit the mean age/mass and intrinsic age/mass spread. We assume the measured ages/masses (X) are drawn from an underlying true θ distribution that is Gaussian with a mean μ and standard deviation σ. We assume that the true age (mass) distribution is contaminated by stars whose mass is higher than expected. We model these contaminants as also being drawn from another normal distribution with a mean μc and spread σc which has a fractional contribution ϵ to the total age distribution (hence the main population contributes 1 − ϵ).
Current usage metrics show cumulative count of Article Views (full-text article views including HTML views, PDF and ePub downloads, according to the available data) and Abstracts Views on Vision4Press platform.
Data correspond to usage on the plateform after 2015. The current usage metrics is available 48-96 hours after online publication and is updated daily on week days.
Initial download of the metrics may take a while.