Fig. 12.
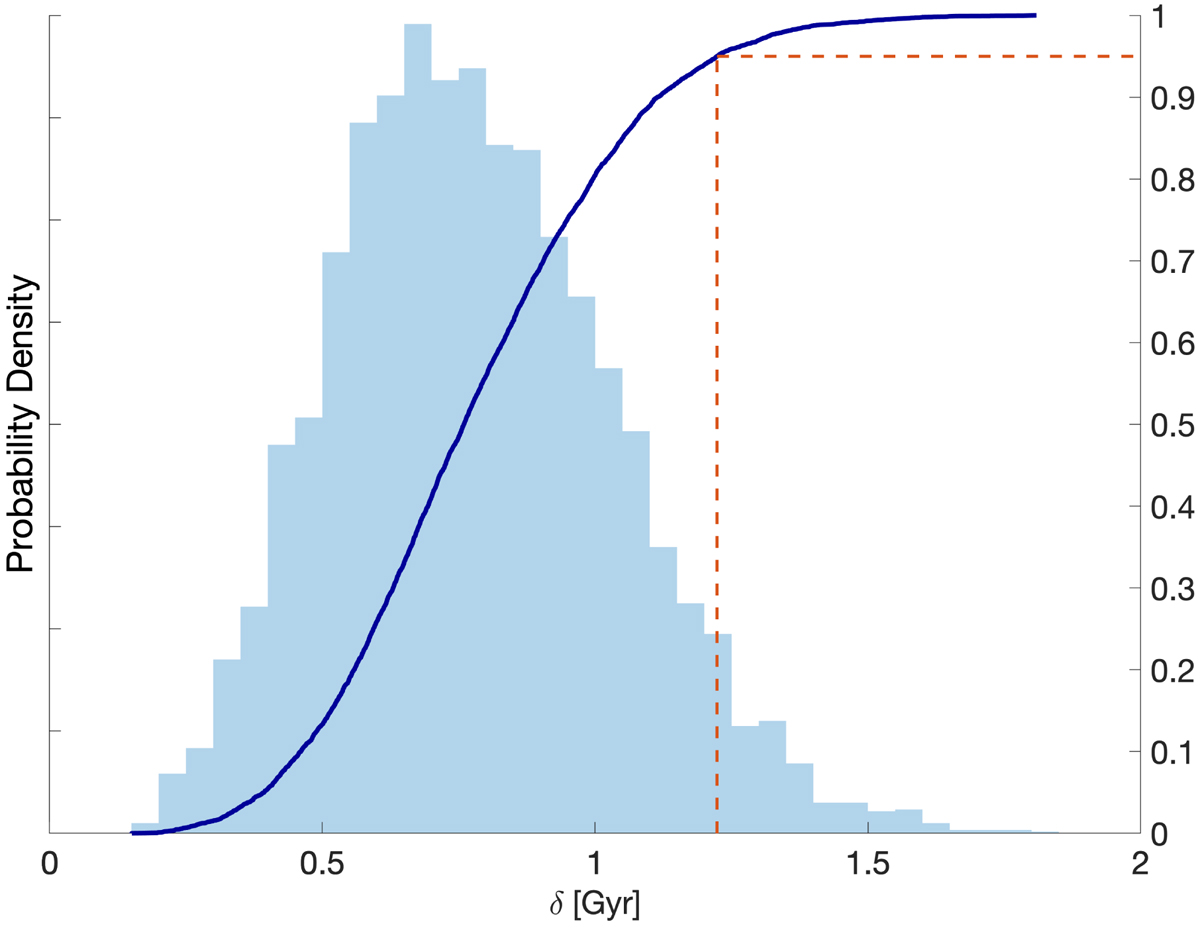
Posterior probability distribution function of the age spread of the high-α population in the sample (R1, see Table 1), resulting from the statistical model described in Appendix B. The cumulative distribution function is shown as a solid line and indicates that the 95% credible interval for the intrinsic age spread corresponds to δ ≲ 1.25 Gyr. Results from all the modelling runs are reported in Table 1.
Current usage metrics show cumulative count of Article Views (full-text article views including HTML views, PDF and ePub downloads, according to the available data) and Abstracts Views on Vision4Press platform.
Data correspond to usage on the plateform after 2015. The current usage metrics is available 48-96 hours after online publication and is updated daily on week days.
Initial download of the metrics may take a while.