Fig. 11.
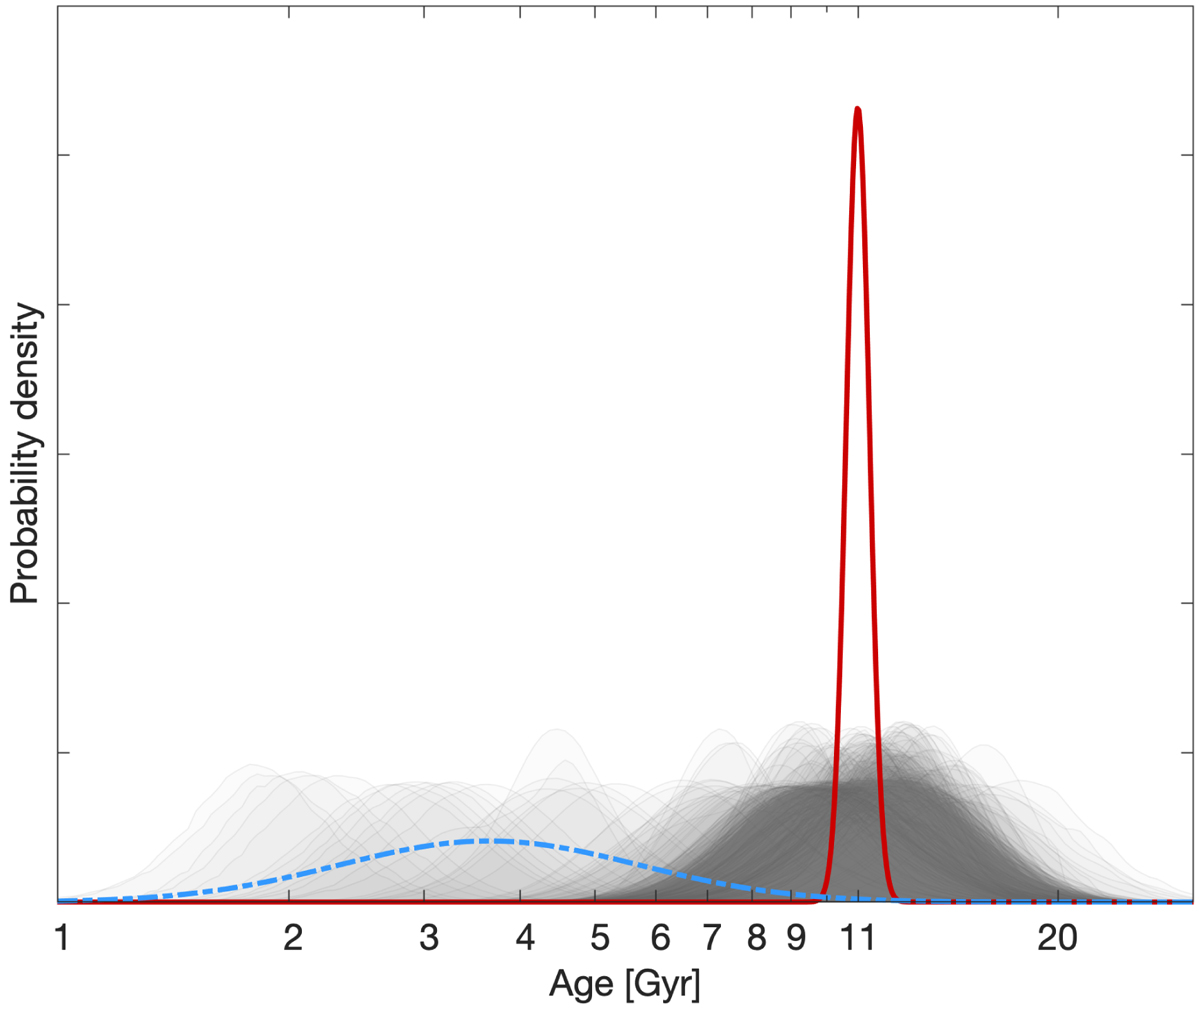
Age posterior probability distribution functions of RGB stars with [α/Fe] > 0.1 (nearly 350 stars, see main text for details about the target selection). The red solid (dashed blue) line shows the intrinsic age distribution of the main population (contaminants) inferred from the statistical model presented in Sect. 4.4. Results shown here refer for the modelling run R1, see Table 1.
Current usage metrics show cumulative count of Article Views (full-text article views including HTML views, PDF and ePub downloads, according to the available data) and Abstracts Views on Vision4Press platform.
Data correspond to usage on the plateform after 2015. The current usage metrics is available 48-96 hours after online publication and is updated daily on week days.
Initial download of the metrics may take a while.