Fig. 7.
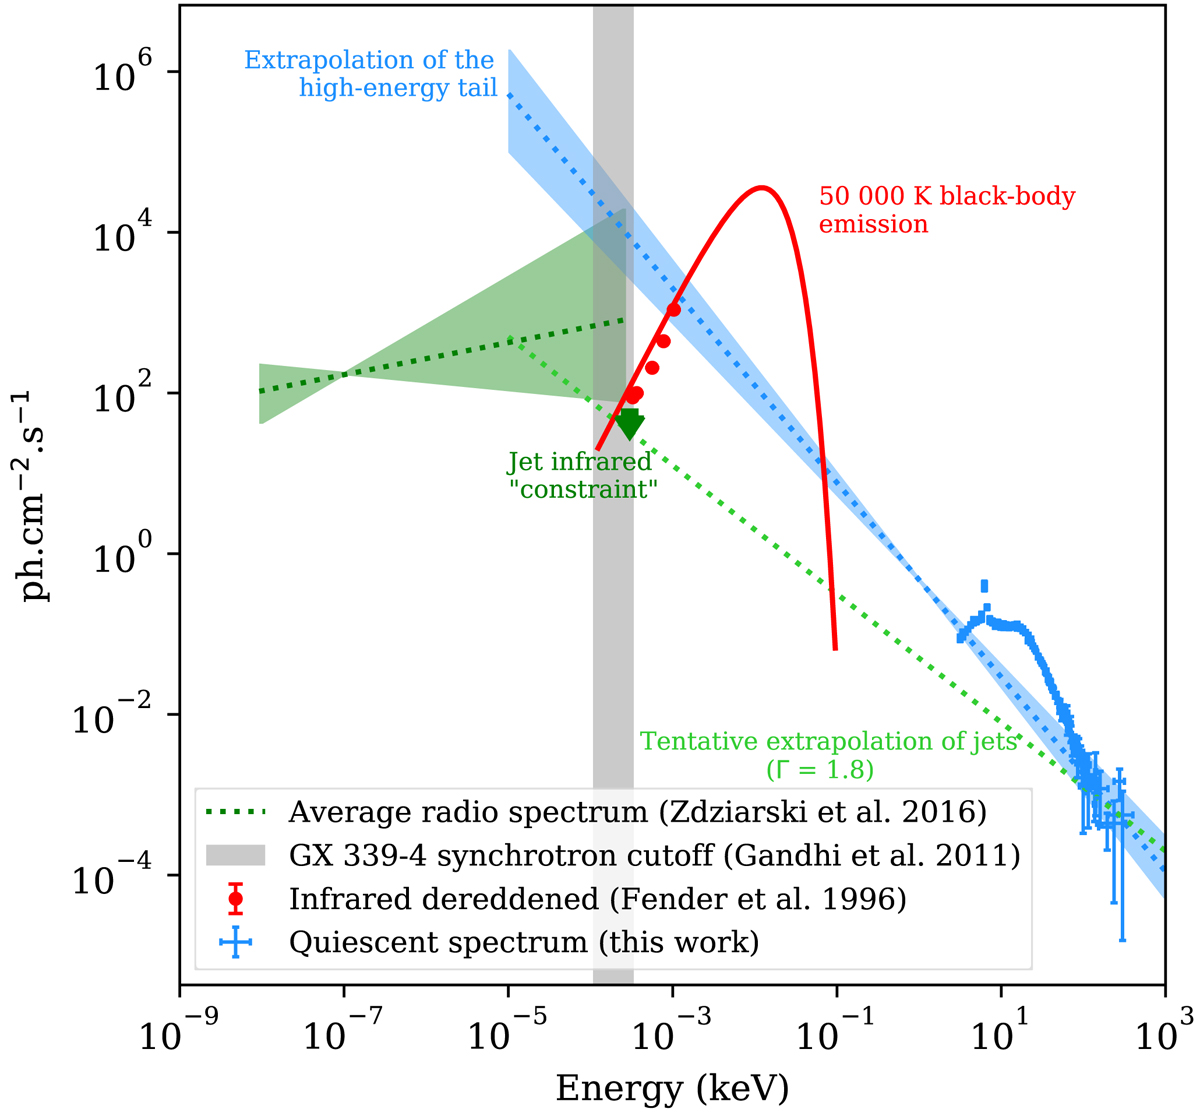
Broad-band spectrum of Cyg X-3 in its quiescent state. Radio spectrum, infrared data, and X-ray data are represented with a dark-green dotted line, red dots, and blue dots, respectively. We also show the extrapolation of the high-energy tail to lower energies with a dotted blue line and a black body emission for a temperature of 50 000 K with a red line. The green arrow shows the rough constraint on the jet synchrotron emission in the infrared imposed by the detected infrared emission associated with stellar emission (Fender et al. 1996), whereas the light-green dotted line shows the high-energy tail with a photon index of Γ = 1.8. The gray zone indicates the energy of the synchrotron cut-off for GX 339-4.
Current usage metrics show cumulative count of Article Views (full-text article views including HTML views, PDF and ePub downloads, according to the available data) and Abstracts Views on Vision4Press platform.
Data correspond to usage on the plateform after 2015. The current usage metrics is available 48-96 hours after online publication and is updated daily on week days.
Initial download of the metrics may take a while.