Fig. 2.
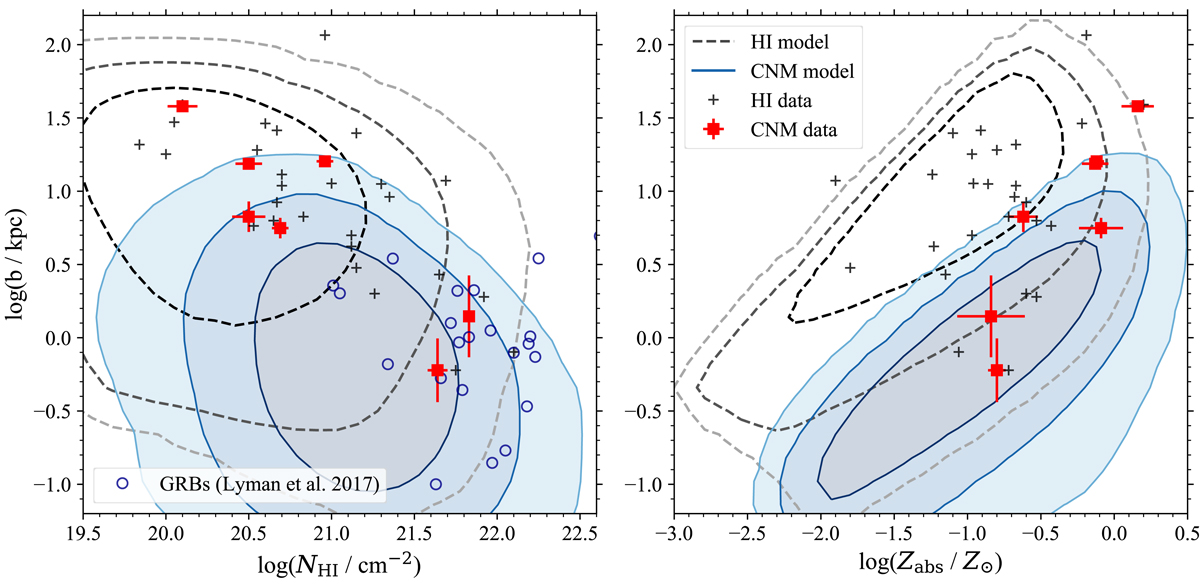
Model prediction for impact parameters as a function of NH I and absorption metallicity. The blue-filled contours indicate the 99th, 95th, and 68th percentiles of the model distribution of CNM absorbers. The dashed contours in gray mark the percentiles of the model distribution of overall H I absorbers. Red and black data points show CNM and H I absorbers (Møller & Christensen 2020), respectively, with identified emission counterparts. The open circles in the left panel show data points for GRBs from Lyman et al. (2017). The majority of the GRBs do not have metallicity measurements and are therefore not shown in the right panel.
Current usage metrics show cumulative count of Article Views (full-text article views including HTML views, PDF and ePub downloads, according to the available data) and Abstracts Views on Vision4Press platform.
Data correspond to usage on the plateform after 2015. The current usage metrics is available 48-96 hours after online publication and is updated daily on week days.
Initial download of the metrics may take a while.