Fig. 8.
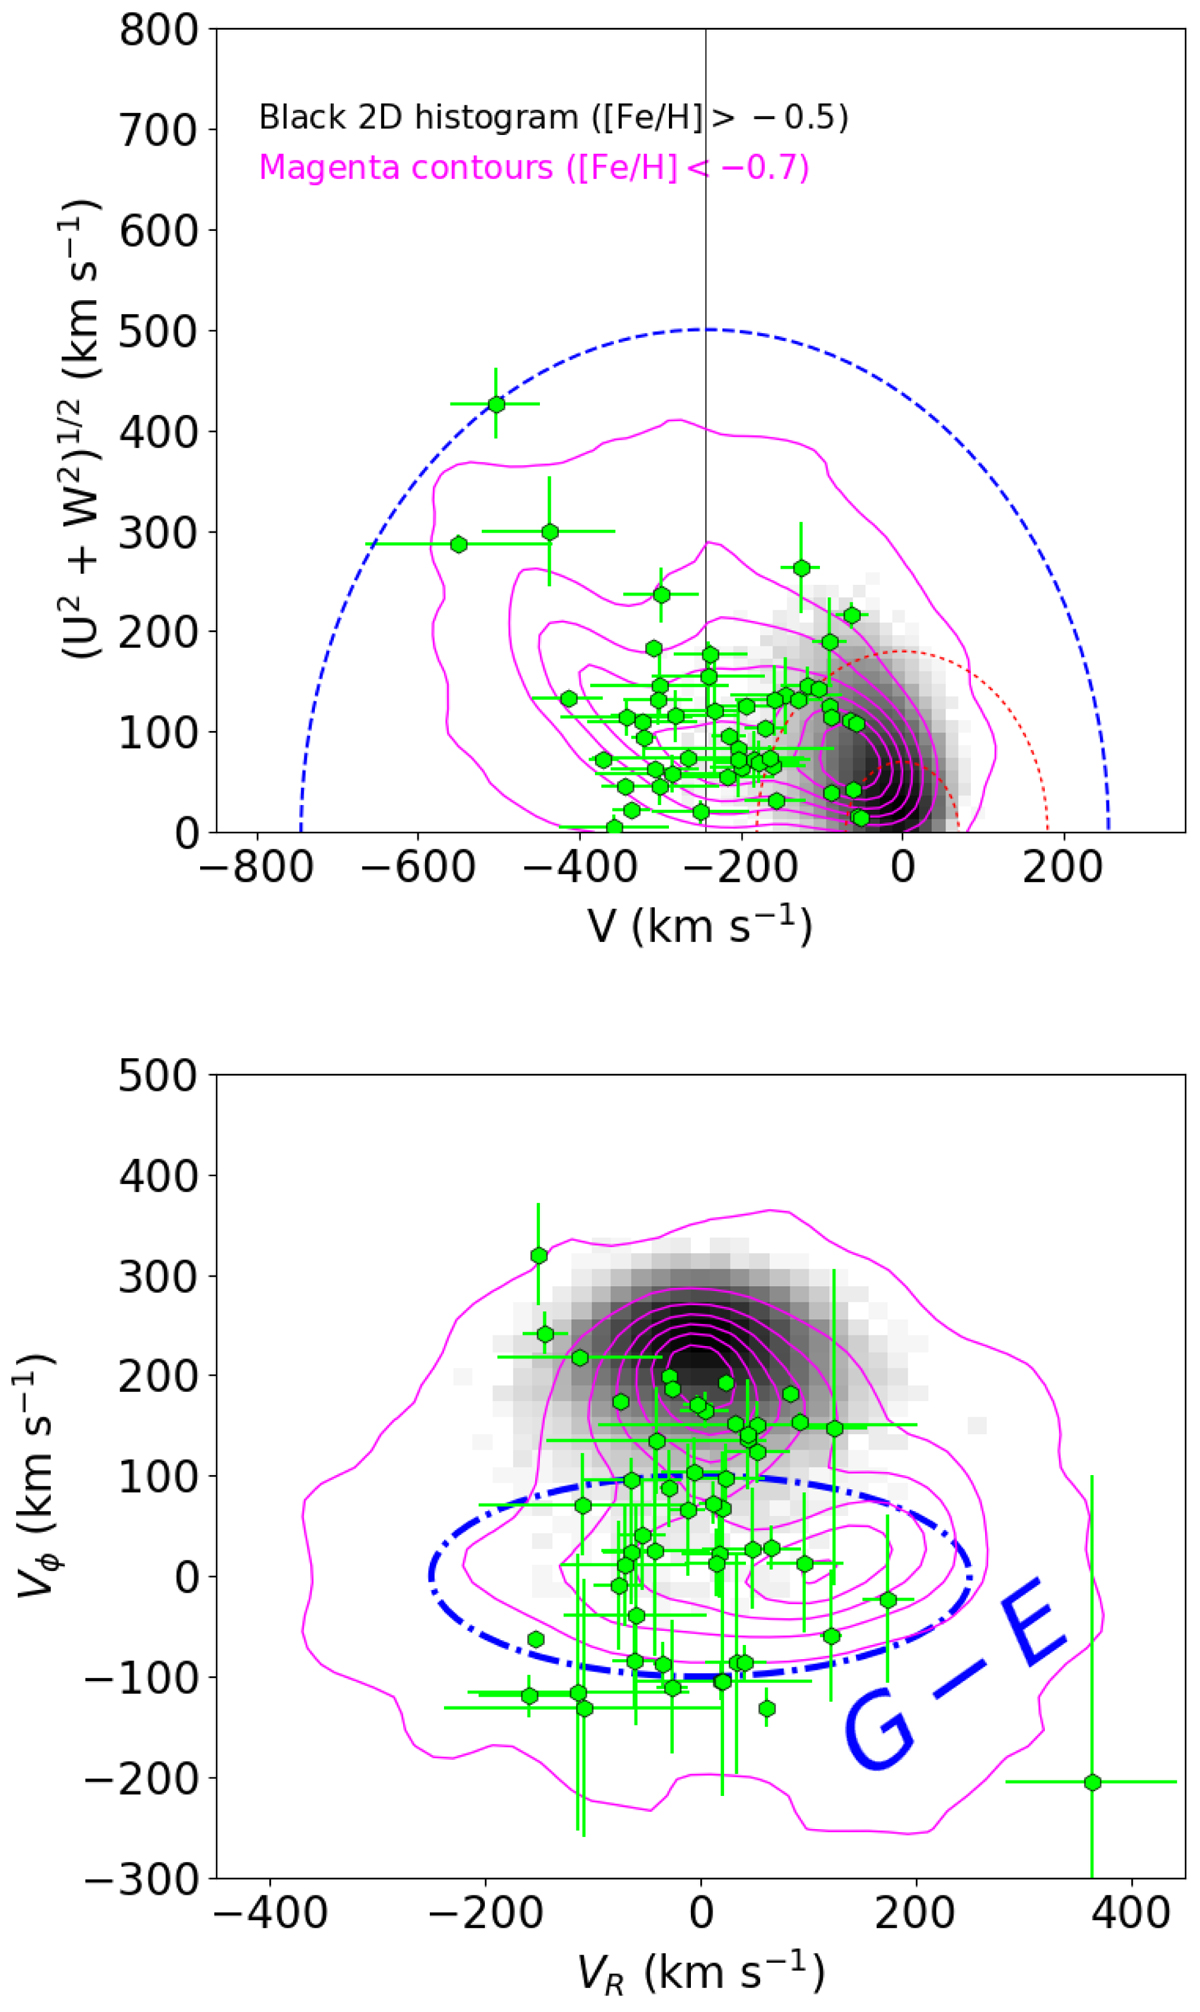
Toomre diagram (top) for the stars in the Jurassic structure (lime symbols) compared to a control sample of ∼200 000 APOGEE-2+ stars with [Fe/H] > −0.5 and d⊙ < 5 kpc, likely associated with the thin and thick disk (2D histrogram), and a sample of ∼11 000 metal-poor stars, [Fe/H] < −0.5, likely associated with the halo and thick disk population (magenta contours). All velocities are relative to the LSR. The red dashed rings show roughly the boundaries of the thin and thick disk at a constant velocity of ∼70 km s−1 and 180 km s−1, respectively (Venn et al. 2004). The blue dashed ring represents a constant galactic-rest frame velocity of ∼500 km s−1 shifted relative to the other velocities. The distribution of the velocity components Vϕ vs. VR (bottom) is also shown for our sample. The blue dashed ellipse represents the approximate region for stars associated with the Gaia-Enceladus in Vϕ vs. VR space based on Belokurov et al. (2018).
Current usage metrics show cumulative count of Article Views (full-text article views including HTML views, PDF and ePub downloads, according to the available data) and Abstracts Views on Vision4Press platform.
Data correspond to usage on the plateform after 2015. The current usage metrics is available 48-96 hours after online publication and is updated daily on week days.
Initial download of the metrics may take a while.