Fig. 5.
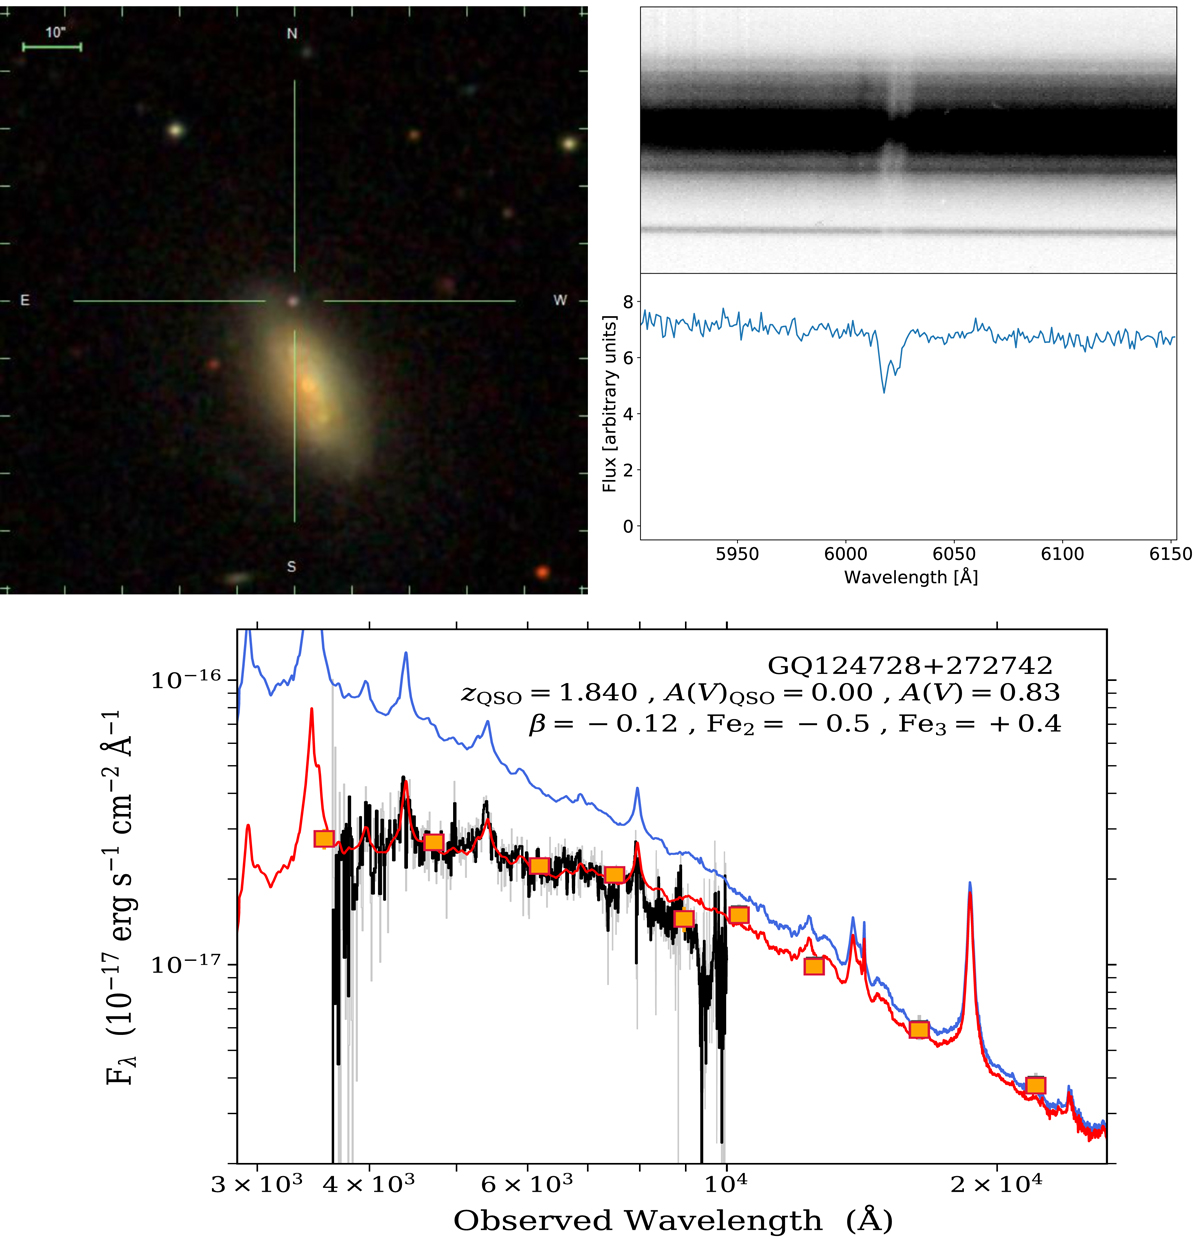
Top left: image of the field of GQ124728+272742 from SDSS. The quasar is marked with a line-of-sight passing through the outskirts of the z = 0.022 foreground galaxy SDSS J124728.37+272728.0. Top right: spectra covering the spectral region around NaD. Top panel: two-dimensional spectrum covering the foreground galaxy and the quasar. The NaD doublet can be seen in absorption against the stellar light of the foreground galaxy and against the quasar continuum. Bottom: analysis of the spectral energy distribution of the quasar. The orange squares mark the photometric measurements from u to z (from SDSS), and from Y to K (from UKIDSS). The black curve represents our observed spectrum. The blue and the red are the quasar composite spectrum from Selsing et al. (2016) without and with extinction, respectively. The parameters of the best fit are given in the upper right corner (following Krogager et al. 2016).
Current usage metrics show cumulative count of Article Views (full-text article views including HTML views, PDF and ePub downloads, according to the available data) and Abstracts Views on Vision4Press platform.
Data correspond to usage on the plateform after 2015. The current usage metrics is available 48-96 hours after online publication and is updated daily on week days.
Initial download of the metrics may take a while.