Fig. 3.
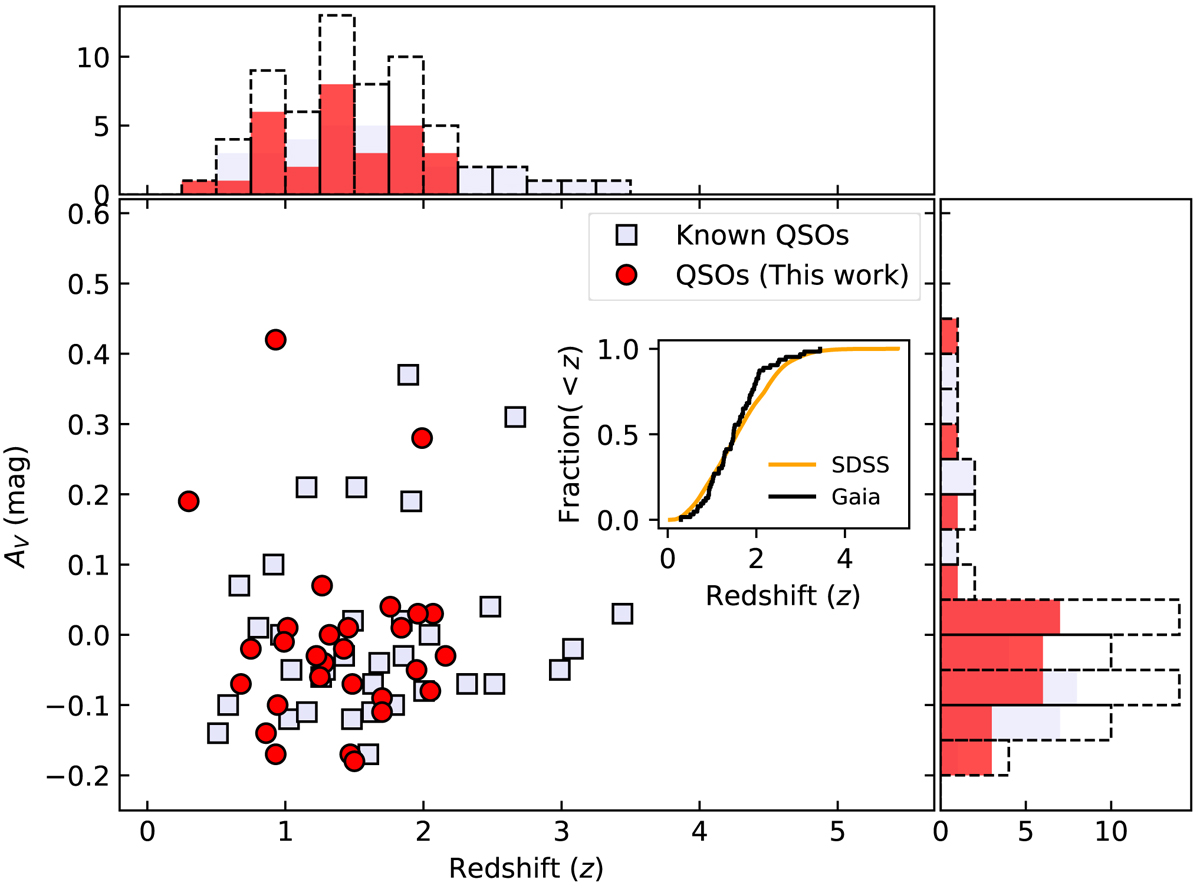
Scatter plot and histograms showing the measured redshift and AV distributions of quasars observed in this work (red filled circles) and those previously identified (grey squares). The black dashed lines in the two histograms show the combined redshift and AV distributions, respectively. In the inset, we show the CDF of the full Gaia-selected quasar sample (black) compared to the CDF of the SDSS-DR14Q sample (orange), considering only the quasars that are brighter than G < 20 mag.
Current usage metrics show cumulative count of Article Views (full-text article views including HTML views, PDF and ePub downloads, according to the available data) and Abstracts Views on Vision4Press platform.
Data correspond to usage on the plateform after 2015. The current usage metrics is available 48-96 hours after online publication and is updated daily on week days.
Initial download of the metrics may take a while.