Fig. A.2.
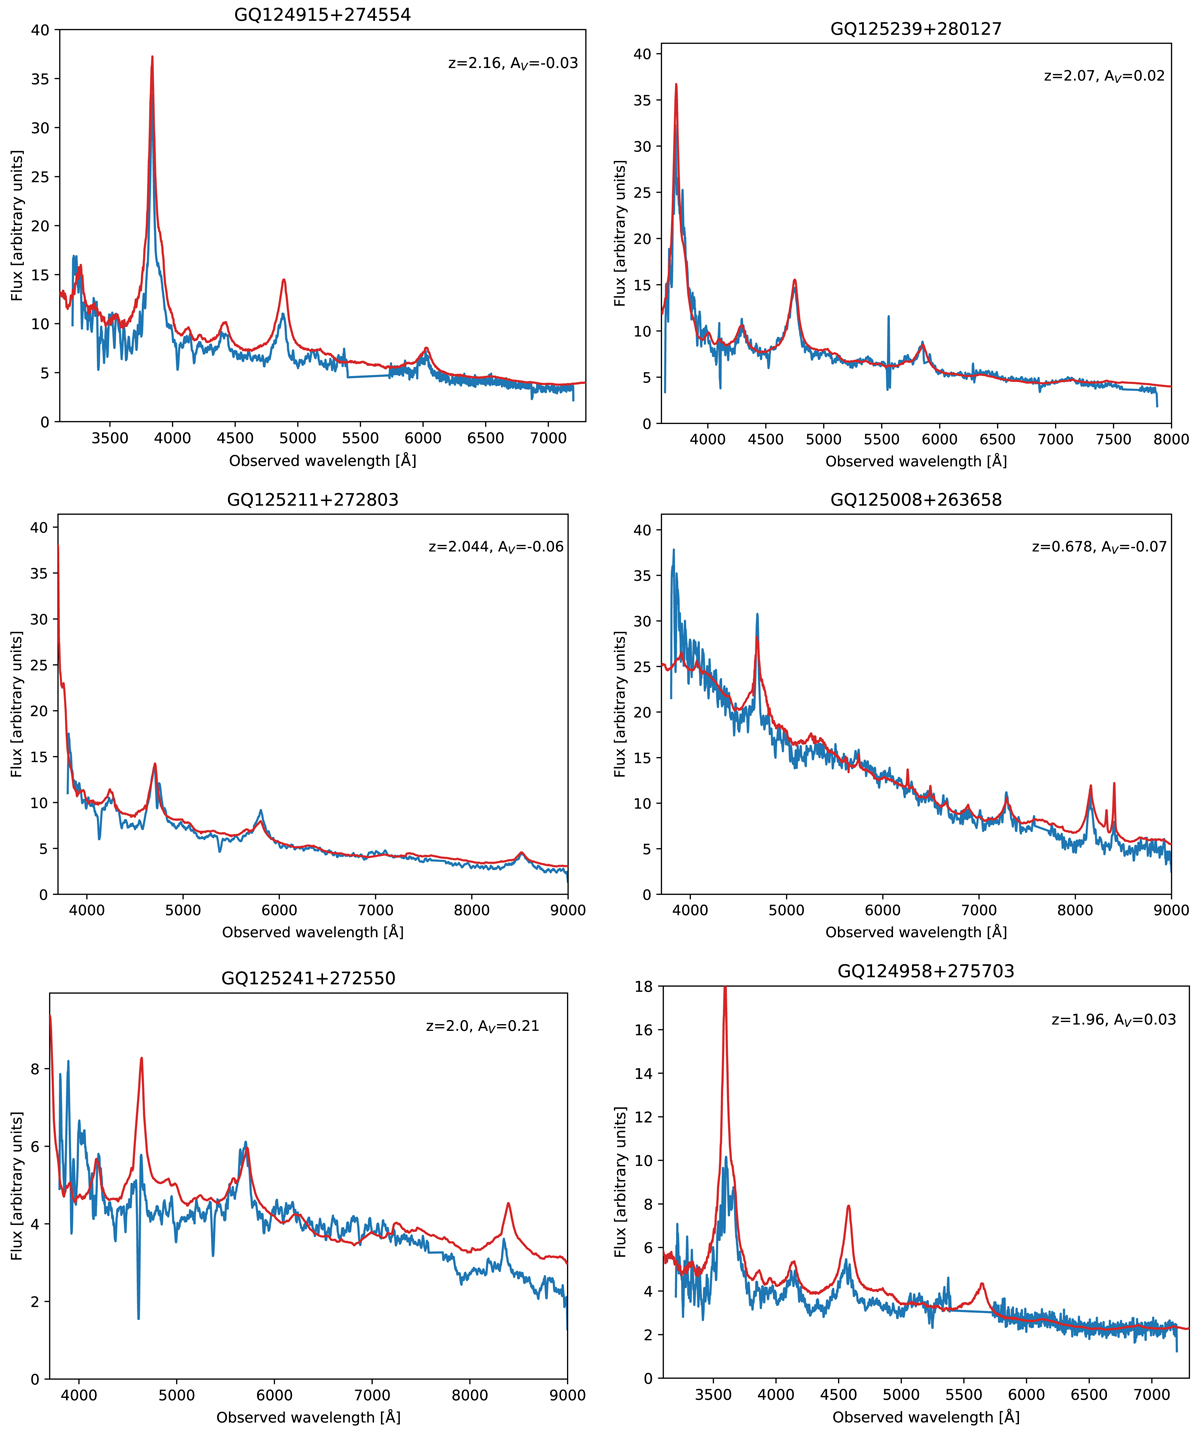
Spectra of all the newly identified quasars in this study. The observed spectra are shown in blue and the redshifted composite model from Selsing et al. (2016) is shown in red. We have given the derived redshift and extinction in the upper right corner of each sub-figure. For the spectra secured with ISIS, we have interpolated across the gap between the two arms of the spectrograph. We have also interpolated across the atmospheric absorption band at 7600 Å.
Current usage metrics show cumulative count of Article Views (full-text article views including HTML views, PDF and ePub downloads, according to the available data) and Abstracts Views on Vision4Press platform.
Data correspond to usage on the plateform after 2015. The current usage metrics is available 48-96 hours after online publication and is updated daily on week days.
Initial download of the metrics may take a while.