Fig. 6
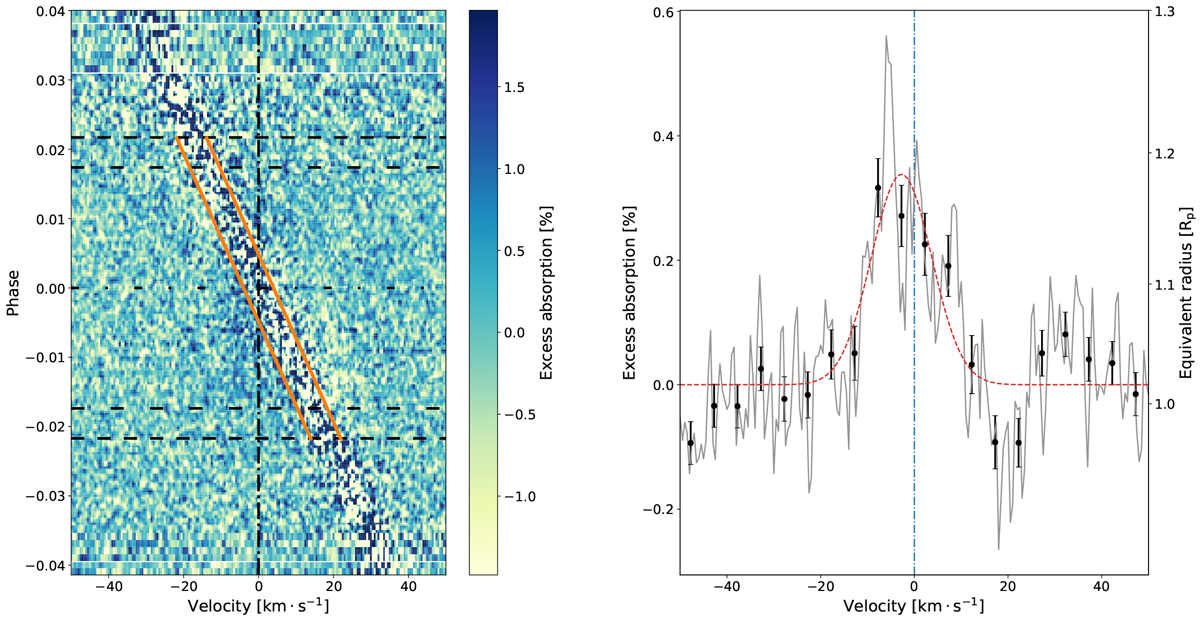
Left: co-addition of the Na doublet lines as a function of orbital phase in the planet rest frame considering the two transits. The vertical black dashed dotted lines represents the expected position of planetary sodium. The two horizontal black dashed lines are the t1 and t4 contact points while the loosely dashed lines are the t2 and t3 contact points. The two orange lines encompass the FWHM of the stellar local lines causing the RM effect. The sodium stellar line core with low S/N is clearly visible in all phases. Right: co-addition of the Na I doublet averaged across the two transitsin gray and binned by ten elements in black. The vertical blue dash dotted line represents the expected position of planetary sodium. The red curve is the best Gaussian fit on the data.
Current usage metrics show cumulative count of Article Views (full-text article views including HTML views, PDF and ePub downloads, according to the available data) and Abstracts Views on Vision4Press platform.
Data correspond to usage on the plateform after 2015. The current usage metrics is available 48-96 hours after online publication and is updated daily on week days.
Initial download of the metrics may take a while.