Fig. 2
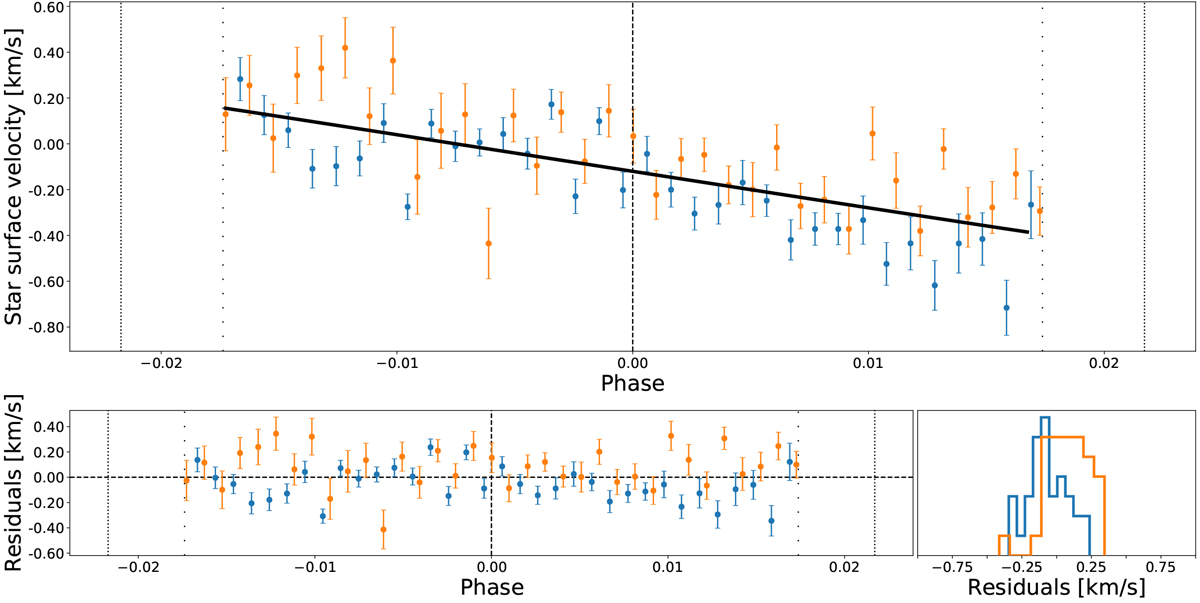
Top: extracted local velocities for both nights (respectively blue and orange for the 2019-02-24 and 2019-03-17) with the best-fit model in black. The vertical dotted lines represent the contact points t1 and t4, the vertical loosely dotted lines represent the contact points t2 and t3, and the vertical dashed line represents mid-transit. Bottom left: local velocity residuals against the best-fit model for both nights. The vertical lines have the same significations as those in the top panel and the horizontal dashed line represents null velocity. Bottom right: distribution of the residuals in the bottom left panel.
Current usage metrics show cumulative count of Article Views (full-text article views including HTML views, PDF and ePub downloads, according to the available data) and Abstracts Views on Vision4Press platform.
Data correspond to usage on the plateform after 2015. The current usage metrics is available 48-96 hours after online publication and is updated daily on week days.
Initial download of the metrics may take a while.