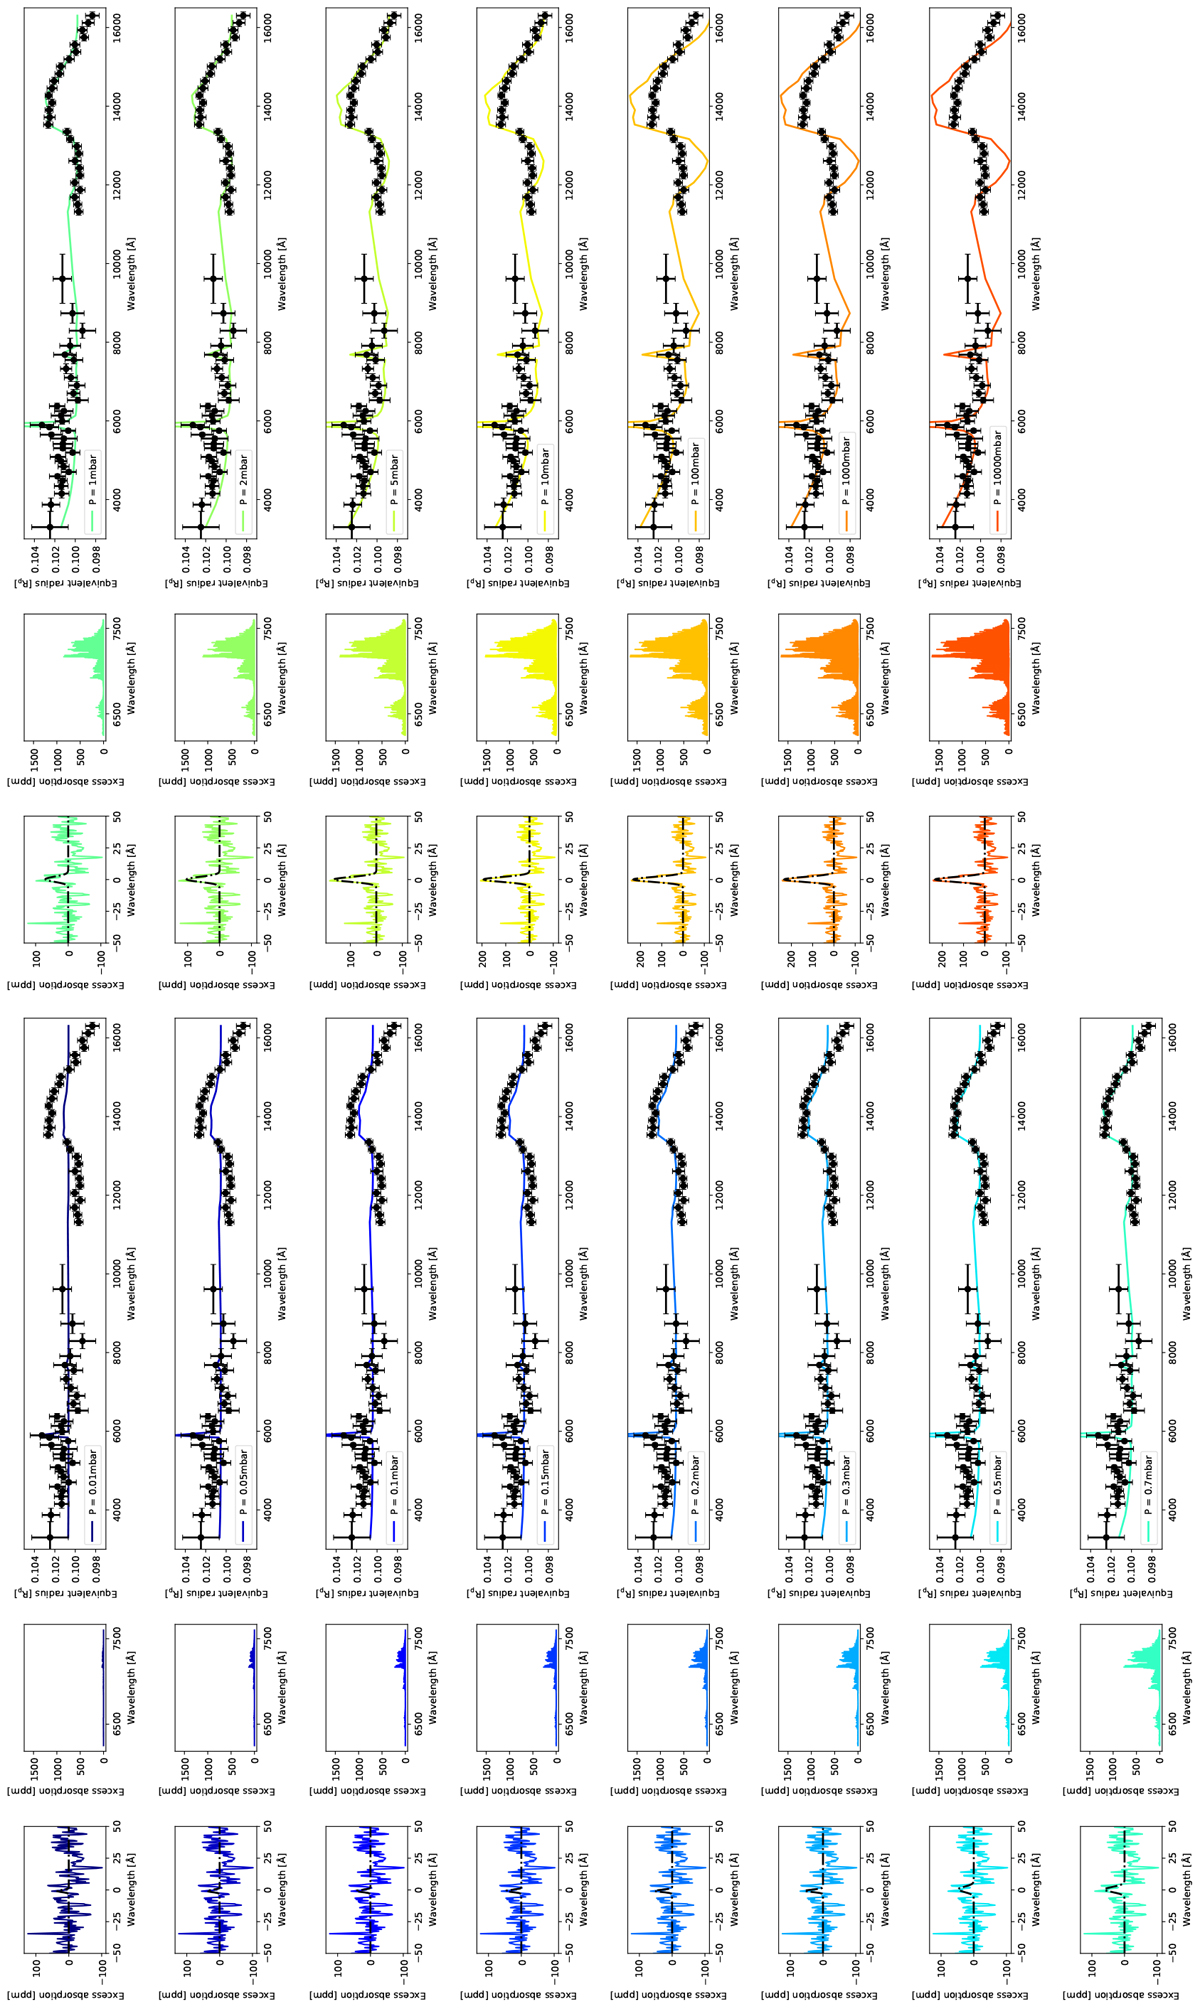
Fig. 15

Combining low- and high-resolution datasets. The color-code is the same as in Fig. 14. Left column: ESPRESSO CCFs with injected models retrieved for the equilibrium temperature and 1600 lines. The best Gaussian-fit model shown in black evaluates whether or not the injected model could be retrieved in the ESPRESSOdata. Middle column: high-resolution model that is injected into the ESPRESSO data. Right column: HST data in black are compared to low-resolution models. A minimization algorithm is applied to estimate the
![]() and BIC of each model compared to the data. Rows: same model with different cuts in pressure simulating different gray cloud-deck.
and BIC of each model compared to the data. Rows: same model with different cuts in pressure simulating different gray cloud-deck.
Current usage metrics show cumulative count of Article Views (full-text article views including HTML views, PDF and ePub downloads, according to the available data) and Abstracts Views on Vision4Press platform.
Data correspond to usage on the plateform after 2015. The current usage metrics is available 48-96 hours after online publication and is updated daily on week days.
Initial download of the metrics may take a while.


