Fig. 14
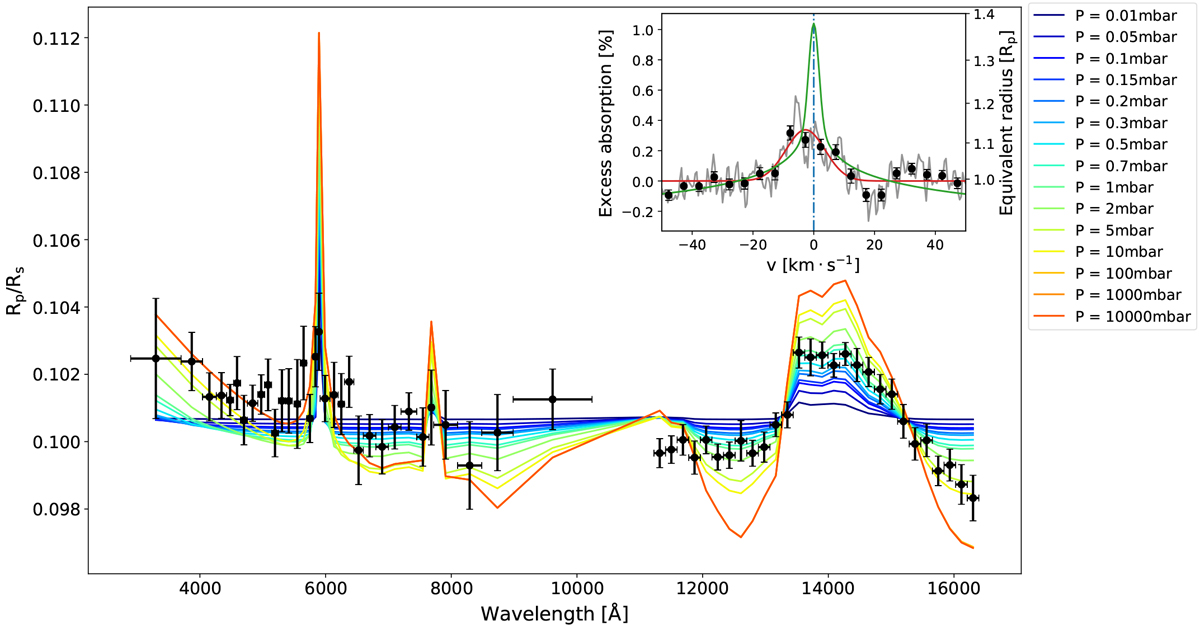
Low-resolution model described in Sect. 7.1 with different cut in pressure to represent various gray cloud-decks (colored curves). In black, the HST data from Spake et al. (2020). The inset is the same as in Fig. 6 (right panel) where we added the high-resolution model Na doublet lines (green) which are not affected by the cloud-deck pressure.
Current usage metrics show cumulative count of Article Views (full-text article views including HTML views, PDF and ePub downloads, according to the available data) and Abstracts Views on Vision4Press platform.
Data correspond to usage on the plateform after 2015. The current usage metrics is available 48-96 hours after online publication and is updated daily on week days.
Initial download of the metrics may take a while.