Fig. 1
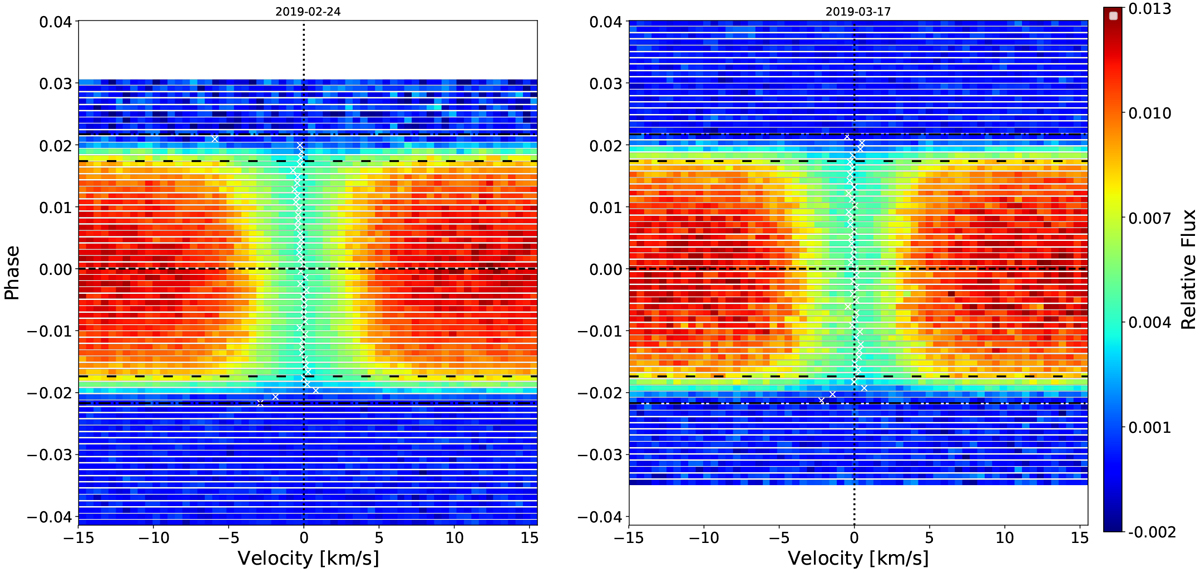
Local CCF map for both nights. Each row corresponds to a local CCF expressed in velocity in the star rest frame at a given time. The two dashed dotted horizontal black lines represent the contact points t1 and t4, the dashed horizontal black lines are t2 and t3, and the vertical dashed black line is at null velocity. The white crosses are the local velocities derived by the Gaussian fit. The RMeffect is clearly visible, as shown by the green trace for both nights.
Current usage metrics show cumulative count of Article Views (full-text article views including HTML views, PDF and ePub downloads, according to the available data) and Abstracts Views on Vision4Press platform.
Data correspond to usage on the plateform after 2015. The current usage metrics is available 48-96 hours after online publication and is updated daily on week days.
Initial download of the metrics may take a while.